10 Best Statistical Analysis Software Reviewed in 2026

10 Best Statistical Analysis Software Shortlist


As a CFO, you're constantly juggling numbers, forecasts, and reports. It's no secret that managing vast amounts of data can be overwhelming. That's where statistical analysis software comes in, helping you make sense of the chaos.
In my experience, these tools offer clarity and precision, turning raw data into actionable insights. They can transform your decision-making process, providing valuable support for your finance team.
In this article, I’ll share my top picks for the best statistical analysis software. You'll find unbiased, well-researched reviews designed to guide you in choosing the right tool for your needs. Let's dive into the options that can make your financial data work for you.
Why Trust Our Software Reviews
We’ve been testing and reviewing financial software since 2023. As finance specialists ourselves, we know how critical and difficult it is to make the right decision when selecting software.
We invest in deep research to help our audience make better software purchasing decisions. We’ve tested more than 2,000 tools for different finance use cases and written over 1,000 comprehensive software reviews. Learn how we stay transparent & our software review methodology.
Best Statistical Analysis Software Summary
This comparison chart summarizes pricing details for my top statistical analysis software selections to help you find the best one for your budget and business needs.
| Tool | Best For | Trial Info | Price | ||
|---|---|---|---|---|---|
| 1 | Best for Salesforce users | Free plan available | From $15/user/month (billed annually) | Website | |
| 2 | Best for large teams with different skill sets | Free trial available | From $99/user/month | Website | |
| 3 | Best for cleaning large volumes of data | Free trial available | From $1,050/individual license/year | Website | |
| 4 | Best dashboards | 30-day free trial + free demo available | Pricing upon request | Website | |
| 5 | Best for Microsoft Excel users | 14-day free trial | From $380/year | Website | |
| 6 | Best cross-department tool | Free demo available | Pricing upon request | Website | |
| 7 | Best for advanced programming | Not available | From $840/year | Website | |
| 8 | Best open-source statistical analysis software | Not available | Free to use | Website | |
| 9 | Best for Mac users | Free trial available | Pricing upon request | Website | |
| 10 | Best for graphing | Free trial available | From $465/year | Website |
-

DealHub AI
Visit WebsiteThis is an aggregated rating for this tool including ratings from Crozdesk users and ratings from other sites.4.7 -
LiveFlow
Visit WebsiteThis is an aggregated rating for this tool including ratings from Crozdesk users and ratings from other sites.4.9 -
Float Financial
Visit WebsiteThis is an aggregated rating for this tool including ratings from Crozdesk users and ratings from other sites.4.2


Best Statistical Analysis Software Reviews
Below are my detailed summaries of the best statistical analysis software that made it onto my shortlist. My reviews offer a detailed look at the key features, pros u0026amp; cons, integrations, and ideal use cases of each tool to help you find the best one for you.
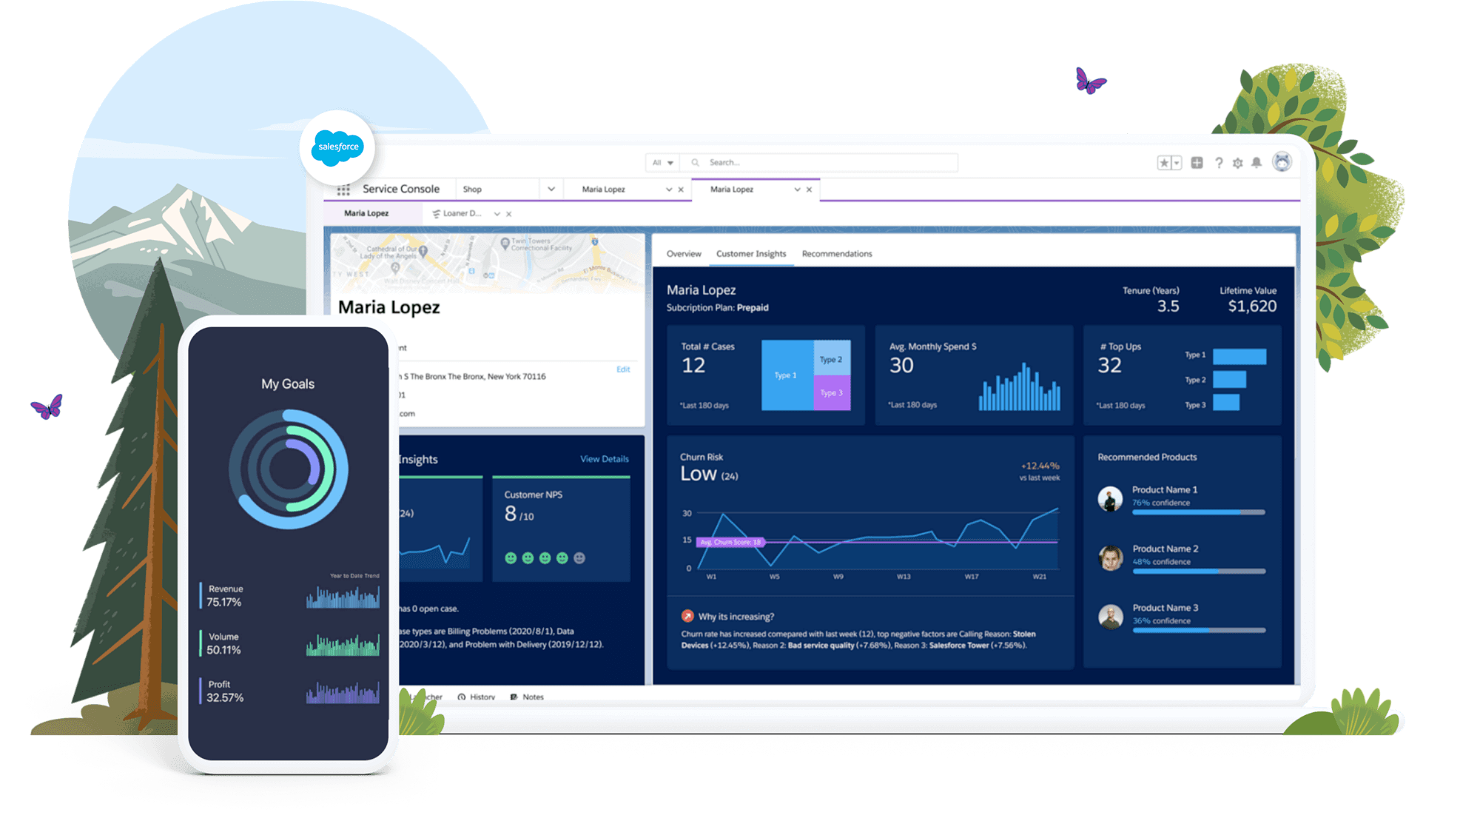
Tableau is Salesforce’s visual analytics platform. You can deploy it on your own servers, in the cloud, or natively integrate it with your Salesforce CRM—perfect if you plan to analyze customer data.
Why I picked Tableau: Tableau's native integration with Salesforce is a significant selling point for any business that already uses the company’s CRM. It’s pretty much the only statistical analysis software with this kind of integration. Of course, you can connect just about any other data source to the platform, too. The software is also powered by Salesforce’s Einstein AI, which allows you to use the tool to make AI-driven predictions based on your data.
Standout features & integrations:
Features include accelerator data mapping, which simplifies dashboard setup by allowing easy mapping of external data. Your team can benefit from dynamic axis titles, letting you update axis titles based on parameter values. Additionally, Tableau Prep improvements enhance data connection and usability, making your data prep process more seamless.
Integrations include Salesforce, Microsoft Excel, Google Sheets, Amazon Redshift, Snowflake, Google BigQuery, SAP Hana, SQL Server, and IBM DB2.
Pros and Cons
Pros:
- Intuitive dashboard with drag-and-drop functionality
- Huge range of other third-party integrations
- Native Salesforce integration
Cons:
- Can take a while to download large data sets
- Visualization features could be improved
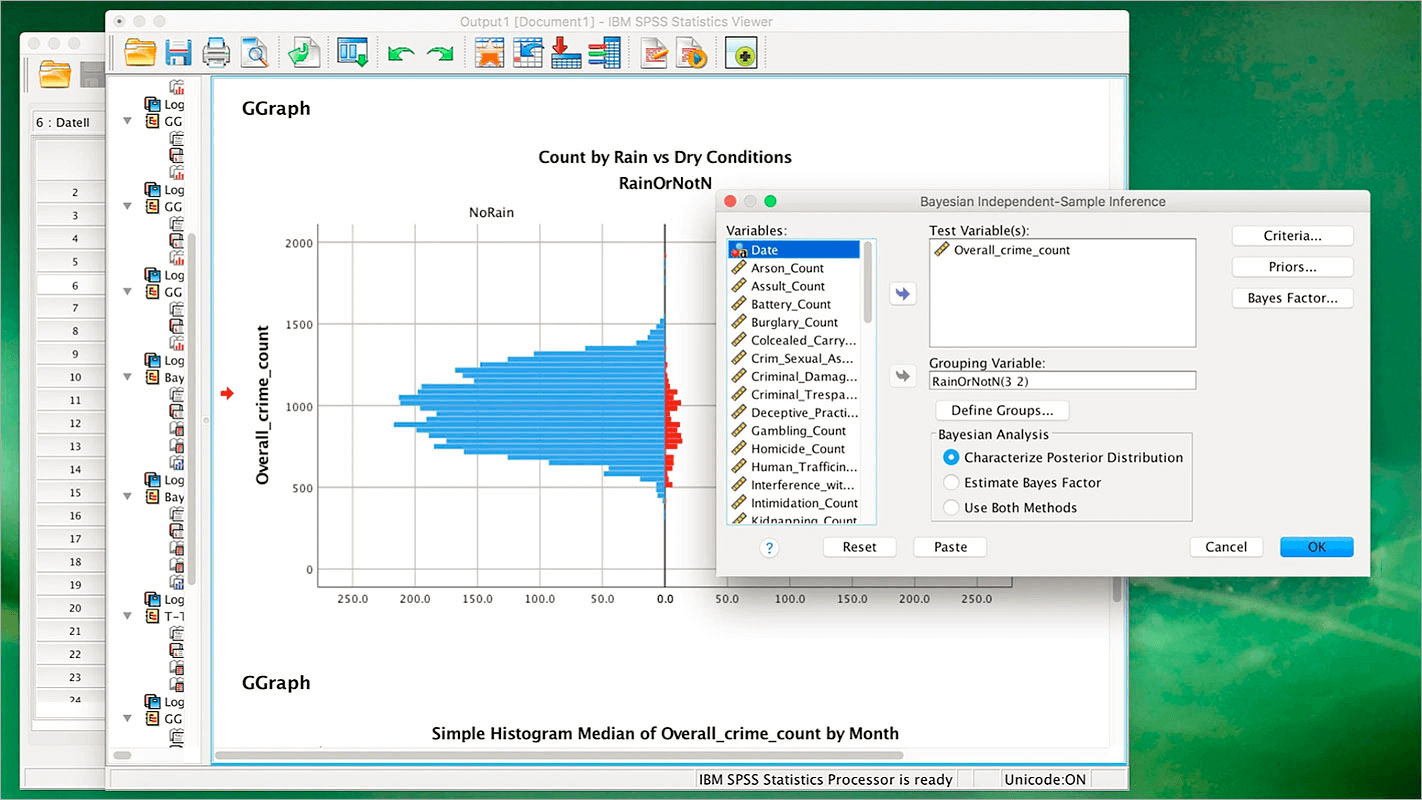
IBM SPSS is a statistical software platform with a user-friendly interface that lets users prepare and analyze data without knowing how to code. The tool uses drag-and-drop functionality to perform analysis and provides a range of technical demos to help you get started.
Why I picked IBM SPSS: Some statistical software platforms overwhelm users with a wealth of features. Others limit capabilities to appeal to a novice audience. But IBM SPSS manages to strike a balance between the two, positioning itself as a user-friendly option while also having a range of comprehensive features (like regression analyses). This makes it easy for inexperienced analysts to get to grips with the platform but means they won't have to switch to a different solution once they become competent.
Standout features & integrations:
Features include a clean, easy-to-use interface and drag-and-drop functionality. All users need to do is point and click on the relevant model to run an analysis on their data. There's also a vast number of statistical models to choose from, ranging from basic functions like frequency modeling to advanced regression modeling, and the platform even automates much of the data preparation process.
Integrations include TIMi and JMP, Voxco Online, and Rotator Survey.
Pros and Cons
Pros:
- Competitive pricing
- Wide range of statistical models
- Fantastic user interface
Cons:
- Reporting features lack flexibility
- Some very advanced models are missing

MATLAB is a statistical analysis software for data cleansing, analysis, and visualization. The platform’s live editor lets you interactively perform iterative tasks like cleansing and labeling data.
Why I picked MATLAB: Messy data can ruin results. That’s why MATLAB is suitable for any CFO blessed with a large data set who wants to cleanse and label data before analyzing thoroughly. Don’t let the fact that the tool is primarily used for academic purposes—it’s very useful for analyzing business data and generating meaningful reports.
Standout features & integrations:
Features include built-in tools for numerical computing that let you analyze data and create algorithms. You can visualize your work using customizable plots and charts that help you see patterns clearly. MATLAB also lets you write scripts and functions to automate tasks and boost your efficiency.
Integrations include Simulink, Excel, Python, C++, Java, Fortran, Amazon Web Services, Google Cloud, ThingSpeak, and Arduino.
Pros and Cons
Pros:
- Custom visual creation
- Intuitive graphical interface
- Multiple data cleansing tools
Cons:
- Learning curve can be steep
- Requires significant processing power to run
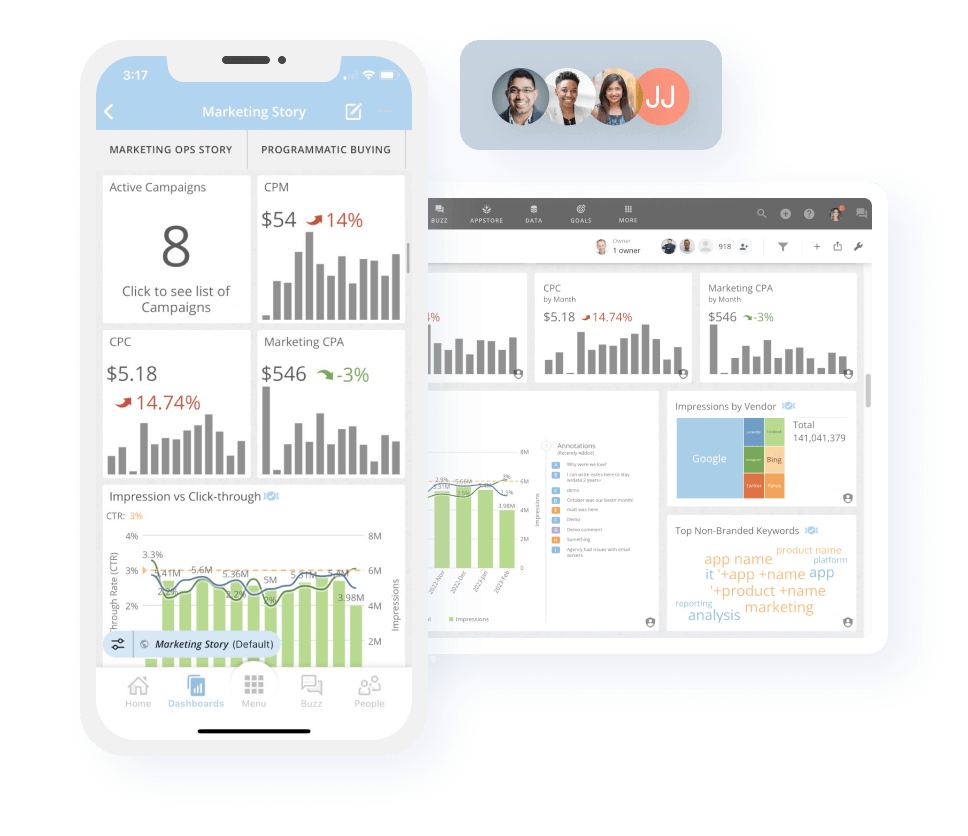
Domo is a cloud-based data platform designed to help everyone in your organization better use business data. The software’s intuitive dashboards and reporting make it simple for even first-time analysts to generate insights and put data to work.
Why I picked Domo: Of all the statistical analysis software tools in this list, Domo is probably the most user-friendly. The software automates data extraction, meaning data can be transferred from spreadsheets to dashboards in real-time, while its embedded analytics even lets you share dashboards externally with clients or partners.
Standout features & integrations:
Features include user-friendly data analysis tools that make it easy for you and your team to dive into the data, regardless of skill level. The software provides advanced regression techniques to help you gain predictive insights and make informed decisions. Additionally, IBM SPSS offers strong data management capabilities, ensuring that your data is organized and accessible for analysis.
Integrations include native connections with IBM Cognos Analytics, Microsoft Excel, R, Python, IBM Watson Studio, Hadoop, Apache Spark, Amazon Web Services, Google Cloud, and Microsoft Azure.
Pros and Cons
Pros:
- Great UI
- Real-time data feeds
- Customizable dashboards and reports
Cons:
- Customer support is lacking
- Lacks advanced functionality

XLSTAT is a leading statistical analysis software solution designed specifically for Microsoft Excel. It natively integrates into the spreadsheet, allowing you to analyze business data without leaving the platform.
Why I picked XLSTAT: If the native integration with Microsoft Excel wasn’t enough, business analysts and CFOs can use XLSTAT without knowing how to code. You can produce in-depth data reports and customizable Excel charts, and replicate many of the other capabilities of the other platforms on this list.
Standout features & integrations:
Features include an advanced suite of over 250 tools for data analysis. The software also offers advanced machine learning tools, allowing your team to integrate R scripts for strong regression and classification tasks.
Integrations include Microsoft Excel, Word, and PowerPoint.
Pros and Cons
Pros:
- Easy to use
- Excellent customer support
- Native integration with Excel
Cons:
- Can be difficult for novices to use
- Premium pricing can be expensive

SAS Viya is a cloud-based AI, analytics, and data management platform. You can integrate data from almost any source and run collaborative data prep and analysis functions as a team.
Why I picked SAS Viya: Collaboration is at the heart of the SAS Viya platform. With this tool, businesses can create a shared space where anyone in the data team can work on analysis together. For example, data engineers can create scalable pipelines, data scientists can transform those data sets into structured data, and business analysts can use advanced analytics tools to derive insights.
Standout features & integrations:
Features include machine learning capabilities that empower you to derive insights from large datasets with ease. The interactive interface also allows your team to explore data visually, enhancing collaboration and decision-making.
Integrations include Microsoft Azure, Amazon Web Services, Google Cloud, Microsoft Office, Hadoop, SAP, Salesforce, IBM, and Teradata.
Pros and Cons
Pros:
- Very fast processing
- Easy to connect different data sources
- Great collaborative features
Cons:
- Not the most intuitive platform
- Can be expensive depending on usage

Stata is an advanced software package that runs the statistical analysis gamut from data preparation and manipulation through to visualization and automated reporting. The program includes Mata, an advanced programming language that adds direct support for matrix programming.
Why I picked Stata: While you don’t need to program to use Stata, the platform’s in-built language gives advanced users a development environment where they can produce and compile code. The tool also offers PyStata, a Python integration that lets you integrate Python into your code.
Standout features & integrations:
Features include advanced statistical models that cater to a range of disciplines, offering your team the tools for both simple and complex data analysis. You can explore data with enhanced graphical capabilities, making it easier to visualize trends and patterns. Additionally, Stata supports Bayesian model averaging and causal mediation analysis, which are valuable for nuanced statistical interpretations.
Integrations include Python, R, Excel, SAS, SPSS, MATLAB, SQL Server, PostgreSQL, and MySQL.
Pros and Cons
Pros:
- Exceptional support
- Regularly updated
- Wide range of support for coding languages
Cons:
- Not as beginner-friendly as other tools
- Steep learning curve

Scilab is a free, open-source statistical analysis software under the GPL License. That means you can use the software for any purpose, change the software, and share the software with colleagues.
Why I picked Scilab: Scilab is the only statistical analysis software on this list you can use for free long-term. But that doesn’t mean the software is lacking in capabilities. It still provides many of the data analysis tools and features you need, including numerical analysis, data visualization, and simulations.
Standout features & integrations:
Features include a user-friendly interface that allows you to manage complex calculations and simulations with ease. Scilab offers an extensive set of mathematical functions to support your computational needs, helping your team tackle tasks ranging from basic arithmetic to advanced calculus. Additionally, its open-source nature ensures you can customize and extend the software to fit your unique requirements.
Integrations include MATLAB, LabVIEW, C++, Java, Python, Fortran, COMEDI, and Xcos.
Pros and Cons
Pros:
- Fast processing
- Clean UI
- Free to use and edit
Cons:
- Not that intuitive to use
- Lacks features compared to premium products
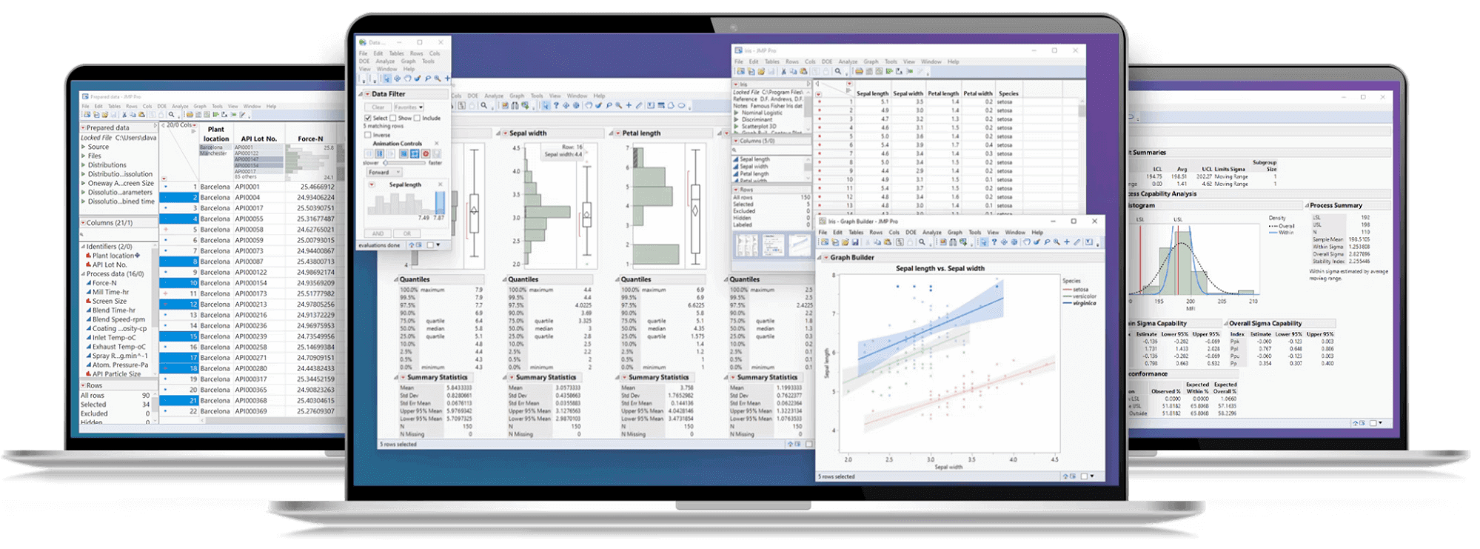
JMP is a desktop statistical software designed to suit all levels of analysis, from engineers to business analysts to scientists. As you’d expect from any Mac product, it features a clean user interface making it straightforward for anyone to start using the tool.
Why I picked JMP: The native macOS client is a significant selling point, given that not all desktop-based statistical analysis software tools work on the operating system. But JMP is not limited because of that, though. You’ll still get all of the tools you need to understand business data delivered through a no-code solution.
Standout features & integrations:
Features include dynamic data visualization tools that let you quickly explore trends and patterns in your data. Your team can also utilize built-in statistical modeling to gain insights without needing advanced programming skills. In my experience, the interactive dashboards make it easy to share findings and collaborate effectively.
Integrations include Excel, R, Python, SAS, MATLAB, Minitab, Tableau, JMP Live, SQL Server, and Oracle NetSuite.
Pros and Cons
Pros:
- Wide range of graphics
- Great dashboarding capabilities
- Native Mac client available
Cons:
- Fixing errors and bugs can be time-consuming
- Can have a long learning curve
OriginPro is a scientific graphing and data analysis tool used by over half a million engineers and scientists to create visual representations of data without the need for programming.
Why I picked OriginPro: If you want to visually represent data there are few better options than OriginPro. The software has over 100 built-in graph types and allows point-and-click customization of every element of them. You can even save customized graphs as new templates, so you don’t have to create them from scratch for future reports.
Standout features & integrations:
Features include intuitive data organization with a spreadsheet-style interface that keeps your work tidy and accessible. You can easily create multi-panel graphs to compare datasets side by side. The software also provides batch processing tools to save time when handling repetitive tasks.
Integrations include MATLAB, Excel, Python, LabVIEW, LabTalk, SQL Server, R, MySQL, Origin C, and COM.
Pros and Cons
Pros:
- Good support team
- Intuitive UI
- Great graphical analysis
Cons:
- Lacking help section
- Program occasionally crashes
Other Statistical Analysis Software
Here are some additional statistical analysis software options that didn’t make it onto my shortlist, but are still worth checking out:


How I Evaluate Statistical Analysis Software
Statistical analysis software is what a biostatistician reaches for when modeling clinical trial outcomes, what a quality engineer uses to run a capability study before a product launch, and what an FP&A team leans on when they need more than a pivot table to make sense of variance trends across business units. I think about every tool in this category across two layers: what it has to do just to make the list, and what actually makes one pick meaningfully better than another for a specific type of user or workflow.
Core Functionality (Table Stakes for This List)
For statistical analysis software, the core functionality I test and evaluate is:
- Statistical testing: I check whether each tool covers the essentials — t-tests, ANOVA, chi-square, and regression — and then push into more advanced territory like survival analysis or mixed-effects models. If I can't run a two-way ANOVA with post-hoc comparisons without workarounds, it's a red flag.
- Data preparation: I look at how well a tool handles the messy reality of raw data, from recoding variables and handling missing values to merging datasets from different sources. A clinical researcher combining survey responses with lab results shouldn't need a separate tool to clean and reshape data first.
- Regression and modeling: I test whether the tool supports multiple regression types — linear, logistic, and multivariate at minimum — and whether it surfaces diagnostics like residual plots, multicollinearity checks, and goodness-of-fit statistics alongside the model output.
- Statistical visualization: I evaluate whether the tool generates analysis-ready graphics like box plots, histograms, Q-Q plots, and scatter matrices that are tightly linked to statistical output. An FP&A analyst presenting a forecast model to leadership shouldn't have to rebuild every chart in a separate design tool.
- Reproducibility: I look for scripting, syntax, or saved workflow capabilities that let you rerun an entire analysis when new data arrives. If a quality engineer runs a process capability study every quarter, they need to replicate it exactly — not rebuild it from scratch.
- Output and reporting: I test how easily a tool produces exportable, formatted tables of results with coefficients, p-values, and confidence intervals that are ready for a report or regulatory submission.
- Data import flexibility: I check support for common file types like CSV, Excel, and database connections, as well as more specialized formats like SAS datasets or SPSS files. Cross-format compatibility matters when teams work across multiple platforms.
If a tool can't do these things reliably, it didn't make the cut regardless of what else it offers.
Standout Features (What Separates the Picks)
I pay close attention to things like built-in automation, workflow scripting, and the scale a tool can handle, plus support for advanced methods like Bayesian modeling or machine learning. I also look for unique integrations—like direct database connections, cloud deployment, one-click regulatory validation, or powerful data visualization extras—that help real teams work faster across departments, platforms, and deadlines.
What I Weigh Beyond Features
I look at who each tool actually serves best — a quality team at a manufacturer has different needs than an economist at a university. Licensing costs and switching friction matter too, since retraining a department on new syntax is expensive. I also evaluate deployment options, regulatory fit for industries like pharma, community and vendor support quality, and how well the tool connects to existing data infrastructure like SQL databases or cloud warehouses.
How to Choose Statistical Analysis Software
Choosing statistical analysis software can get overwhelming fast. So, I made this simple checklist to help you compare tools, spot must-have features, and feel confident in your decision. Use it to keep your search focused and efficient.
| Factor | What to Consider |
|---|---|
| Scalability | Ensure the software can handle your data growth. Look for solutions that scale with your needs without performance loss. |
| Integrations | Check if it integrates with your existing tools, like other business accounting software, CRMs, or ERP systems, to streamline workflows. |
| Customizability | Look for software that lets you tailor functionalities to fit your specific analytical requirements. |
| Ease of Use | Prioritize intuitive interfaces that require minimal training for your team to navigate efficiently. |
| Budget | Assess the total cost, including hidden fees, to ensure it aligns with your financial constraints. |
| Security Safeguards | Verify strong data protection measures to keep sensitive information secure from breaches. |
| Support | Consider the availability and quality of customer support to solve any issues quickly. |
| Data Visualization | Ensure the software offers strong visualization tools to interpret data insights clearly. |
What Is Statistical Analysis Software?
Statistical analysis software is a tool that helps you collect, interpret, and model large data sets to uncover patterns and guide decision-making. Used by financial analysts, researchers, and data scientists, it simplifies complex data through visualization, predictive modeling, and trend analysis.
These tools are essential for transforming raw data into actionable insights, helping businesses forecast performance, manage risk, and stay competitive.
Features
When choosing statistical analysis software, look for features that truly support financial insights for your business. This could be time-series analysis, forecasting models, risk modeling, or Monte Carlo simulations. Other key features to search for include:
- Data Visualization: Presents complex data and statistical analysis results in an understandable format through graphs and charts.
- Descriptive Statistics: Provides basic statistical measures such as mean, variance, and standard deviation to summarize data sets.
- Hypothesis Testing: Allows users to test assumptions about a data set, which is crucial for scientific research.
- Regression Analysis: Helps in understanding relationships between variables and predicting future trends based on historical data.
- Data Import/Export: Facilitates easy import of data from various sources and export of analysis results to different formats.
- Automated Reporting: Generates advanced reports automatically, saving time and reducing the risk of human error.
- Real-Time Analysis: Enables analysis of data as it is collected, which is essential for time-sensitive decision-making.
- Data Management: Provides tools for organizing, storing, and retrieving data efficiently.
- Advanced Statistical Methods: Includes a wide range of strong statistical techniques for in-depth analysis.
- Integration Capabilities: Allows seamless integration with other software tools, enhancing overall functionality and user productivity for teams of all sizes.
Benefits
Whether you choose SAS, R, or Python, statistical analysis software offer you a competitive edge in finance. Here are some of the common benefits you can expect with the best software for statistical analysis:
- Increased Accuracy: Reduces calculation errors, ensuring more accurate data analysis and conclusions.
- Time Savings: Automates complex calculations, allowing for faster data processing and analysis.
- Data Visualization: Creates charts and graphs, making it easier to understand and interpret data insights.
- Enhanced Decision-Making: Provides reliable data analysis, helping teams make informed business decisions based on corporate performance metrics.
- Scalability: Handles large datasets efficiently, enabling analysis of extensive information without performance issues.
- Consistency: Standardizes data analysis processes, ensuring consistent results across different datasets and projects.
- Advanced Analytics: Offers complex statistical models and procedures, allowing for deeper insights and predictive analytics. This can be extremely valuable during the close and consolidation process.
Costs & Pricing
I know picking statistical analysis software can get confusing fast. To make it easier, I’ve created a simple table showing common pricing plans, average costs, and what’s included:
| Plan Type | Average Price | Common Features |
|---|---|---|
| Free | $0 | Basic statistical tools, limited data import options, and community support. |
| Personal | $19-$50/user/month | Advanced statistical tools, data visualization, and email support. |
| Business | $51-$125/user/month | Collaboration features, integration with other software, and priority support. |
| Enterprise | Custom Pricing | Comprehensive analytics, dedicated account manager, and advanced security features. |
Statistical Analysis Software FAQs
Here are some answers to common questions about statistical analysis software:
What types of graphs and visualizations can be produced using statistical analysis software?
The four types of graphs used in statistical analysis are bar, line, pie, and histogram charts. Specifically, statistical analysis software can execute a wide range of models and data visualizations, including regression analysis, run charts, pareto charts, variables control charts.
What is the difference between statistical analysis software and data visualization tools?
Statistical analysis software focuses on processing and interpreting data to uncover trends and patterns, while data visualization tools focus on presenting data in a visual format. If you need to perform complex calculations and statistical tests, you’ll want statistical analysis software. However, if your goal is to create charts or graphs, a visualization tool may be sufficient.
Can statistical analysis software handle large datasets?
Yes, most statistical analysis software can handle large datasets. However, the capability to process large volumes of data efficiently depends on the software’s architecture and your system’s resources. Check the software’s specifications for data size limits and ensure your hardware meets recommended requirements to avoid slow performance.
Do I need technical expertise to use statistical analysis software?
Not necessarily. While some software requires a strong understanding of statistics, many modern tools offer user-friendly interfaces and tutorials to help beginners. If you’re new to statistical analysis, look for software with comprehensive support resources like training videos and FAQs to ease the learning curve.
What’s Next:
If you're in the process of researching statistical analysis software, connect with a SoftwareSelect advisor for free recommendations.
You fill out a form and have a quick chat where they get into the specifics of your needs. Then you'll get a shortlist of software to review. They'll even support you through the entire buying process, including price negotiations.