
Sisense Review: Pros, Cons, Features and Pricing
Sisense stands out for its ability to handle complex data analytics with ease, offering a user-friendly interface that empowers your team to gain actionable insights quickly.

We review tools independently, and commissions help fund our testing. See our transparency policy, our methodology, or suggest a tool.
Sisense is a financial analytics software for finance teams that need to blend, analyze, and visualize data from multiple sources without leaning on a data engineering team to do it. I'd consider it over Tableau if your priority is a self-service analytics setup that doesn't require heavy IT involvement to build and maintain dashboards and data models.
Sisense Evaluation Summary
4.4/5
- Pricing upon request
- 7-day free trial
Why Trust Our Software Recommendations
6,700+
Reviews
20
Industry experts
16+
Evaluation factors
14
Years
Our team has been testing and reviewing software since 2012. As finance leaders ourselves, we know how difficult—and important—it is to choose the right software.
For this guide, we evaluated tools using hands-on testing and independent research, scoring tools using our selection criteria.
Our reviews reflect our human editorial judgment, not a sales pitch.
Sisense Overview
In my opinion, Sisense offers a solid platform for financial analytics, particularly excelling with its advanced features like customizable dashboards, embedded analytics, and robust data integration. It's priced competitively, but may not be the cheapest option, offering good value for those needing advanced analytics capabilities with the functionality og a powerful BI tool. Its ease of use is commendable, although onboarding can take some time. Customer support is reliable, though improvements could enhance user satisfaction further. Sisense is ideal for teams looking for a flexible, integrated analytics solution. It might outperform competitors in terms of feature richness but could be less appealing for those prioritizing cost over functionality.
Pros
- You can easily create interactive dashboards with Sisense.
- It handles large data sets efficiently for your team's analysis.
- The user interface is intuitive, helping your team get started quickly.
Cons
- Your team might face a steep learning curve initially.
- Customization options for dashboards are somewhat limited for your needs.
- You may find the onboarding process less smooth than expected.
Is Sisense Right For Your Needs?
Who Would be a Good Fit for Sisense?
Sisense is a great choice for large enterprises and data-driven teams who need to analyze vast amounts of data. If your team works in finance or retail, Sisense's ability to handle complex data sets efficiently can give you the insights you need. It's particularly useful for financial analysts needing interactive dashboards to visualize data quickly. The intuitive interface helps your team dive into analytics without getting bogged down by technicalities.
- Large EnterprisesSisense efficiently manages and analyzes big data, making it perfect for large companies with complex data needs.
- Financial AnalystsThe tool's interactive dashboards allow financial analysts to visualize trends and make informed decisions swiftly.
- Retail IndustrySisense helps retail businesses track sales and customer behavior with ease through comprehensive data visualization.
- Healthcare TeamsHealthcare teams can use Sisense to analyze patient data and improve service delivery by spotting trends.
- Marketing DepartmentsMarketing teams benefit from Sisense's visual analytics to measure campaign performance and adjust strategies on the fly.
- IT DepartmentsIT teams appreciate Sisense for its ability to integrate various data sources and provide a unified view of operations.
Who Would be a Bad Fit for Sisense?
Sisense may not be ideal for small businesses or startups with limited budgets and simpler data needs. If your team doesn't require complex data integrations or advanced analytics, the investment in Sisense might not be justified. Additionally, organizations without dedicated IT support could struggle with the initial setup and learning curve, making it less appealing for teams that need quick, out-of-the-box solutions.
- Small StartupsSmall startups might find Sisense too costly and complex for their basic data analysis needs.
- Non-Technical TeamsNon-technical teams may struggle with Sisense's setup and require more user-friendly solutions.
- Budget-Constrained CompaniesCompanies with tight budgets might not justify the cost of Sisense given their limited data requirements.
- FreelancersFreelancers typically need simpler tools and might find Sisense's features excessive for their projects.
- Small RetailersSmall retailers may not benefit from Sisense's advanced analytics, as their data needs are often straightforward.
- Nonprofit OrganizationsNonprofits with limited tech resources might find Sisense's setup and maintenance demanding.
How We Test & Score Tools
We’ve spent years building, refining, and improving our software testing and scoring system. The rubric is designed to capture the nuances of software selection and what makes a tool effective, focusing on critical aspects of the decision-making process.
Below, you can see exactly how our testing and scoring works across seven criteria. It allows us to provide an unbiased evaluation of the software based on core functionality, standout features, ease of use, onboarding, customer support, integrations, customer reviews, and value for money.
Core Functionality (25% of final scoring)
The starting point of our evaluation is always the core functionality of the tool. Does it have the basic features and functions that a user would expect to see? Are any of those core features locked to higher-tiered pricing plans? At its core, we expect a tool to stand up against the baseline capabilities of its competitors.
Standout Features (25% of final scoring)
Next, we evaluate uncommon standout features that go above and beyond the core functionality typically found in tools of its kind. A high score reflects specialized or unique features that make the product faster, more efficient, or offer additional value to the user.
We also evaluate how easy it is to integrate with other tools typically found in the tech stack to expand the functionality and utility of the software. Tools offering plentiful native integrations, 3rd party connections, and API access to build custom integrations score best.
Ease of Use (10% of final scoring)
We consider how quick and easy it is to execute the tasks defined in the core functionality using the tool. High scoring software is well designed, intuitive to use, offers mobile apps, provides templates, and makes relatively complex tasks seem simple.
Onboarding (10% of final scoring)
We know how important rapid team adoption is for a new platform, so we evaluate how easy it is to learn and use a tool with minimal training. We evaluate how quickly a team member can get set up and start using the tool with no experience. High scoring solutions indicate little or no support is required.
Customer Support (10% of final scoring)
We review how quick and easy it is to get unstuck and find help by phone, live chat, or knowledge base. Tools and companies that provide real-time support score best, while chatbots score worst.
Customer Reviews (10% of final scoring)
Beyond our own testing and evaluation, we consider the net promoter score from current and past customers. We review their likelihood, given the option, to choose the tool again for the core functionality. A high scoring software reflects a high net promoter score from current or past customers.
Value for Money (10% of final scoring)
Lastly, in consideration of all the other criteria, we review the average price of entry level plans against the core features and consider the value of the other evaluation criteria. Software that delivers more, for less, will score higher.
Core Features
Interactive Dashboards
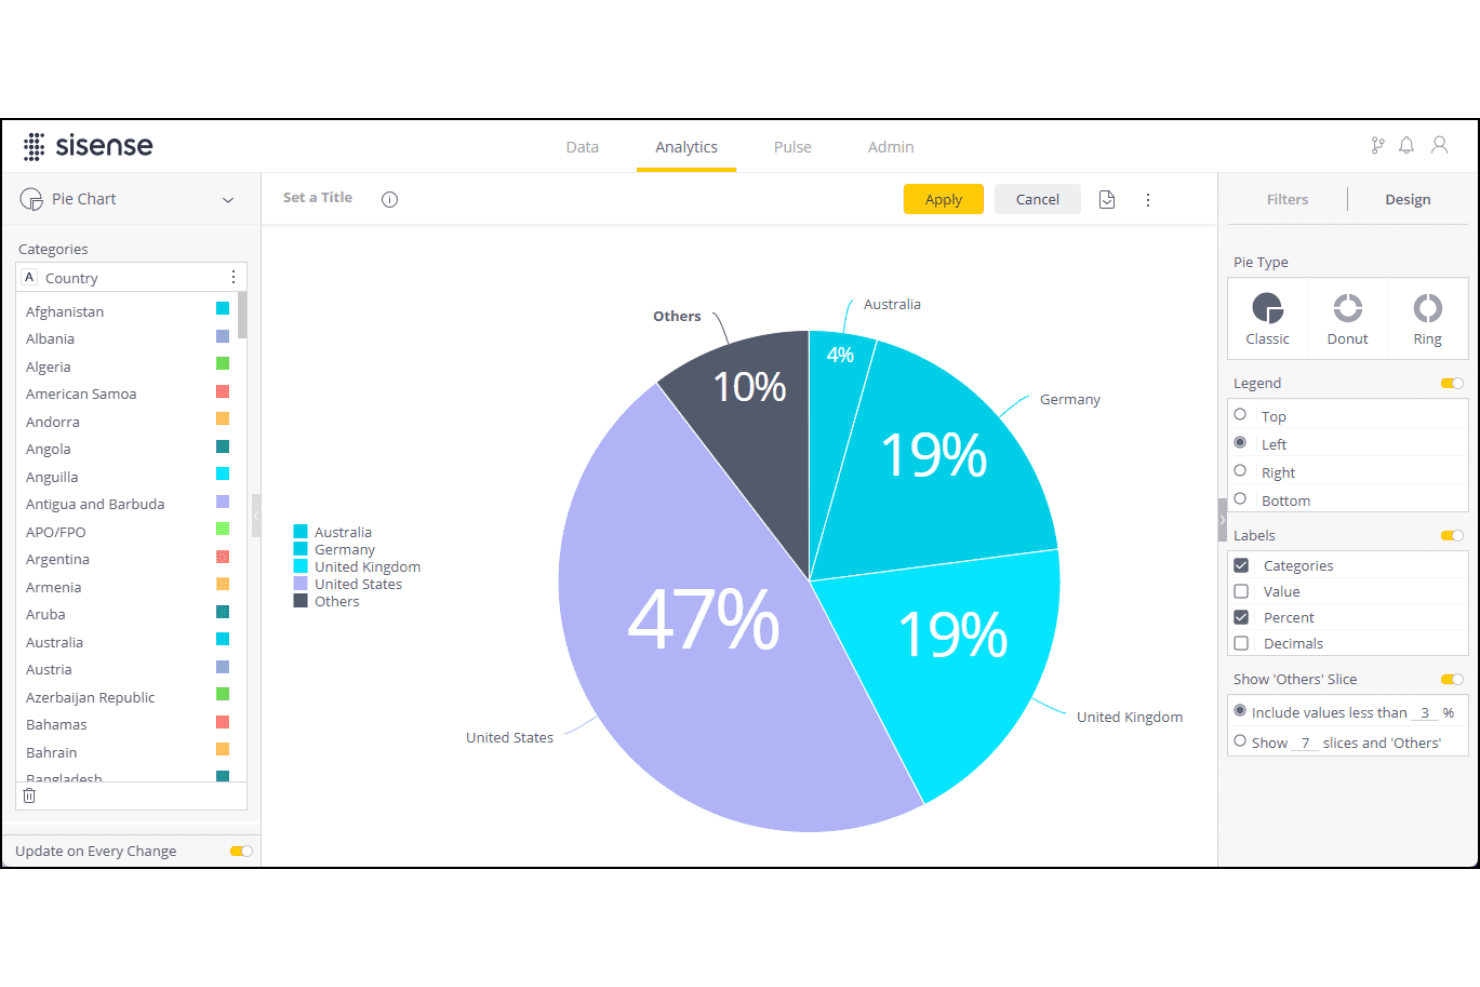
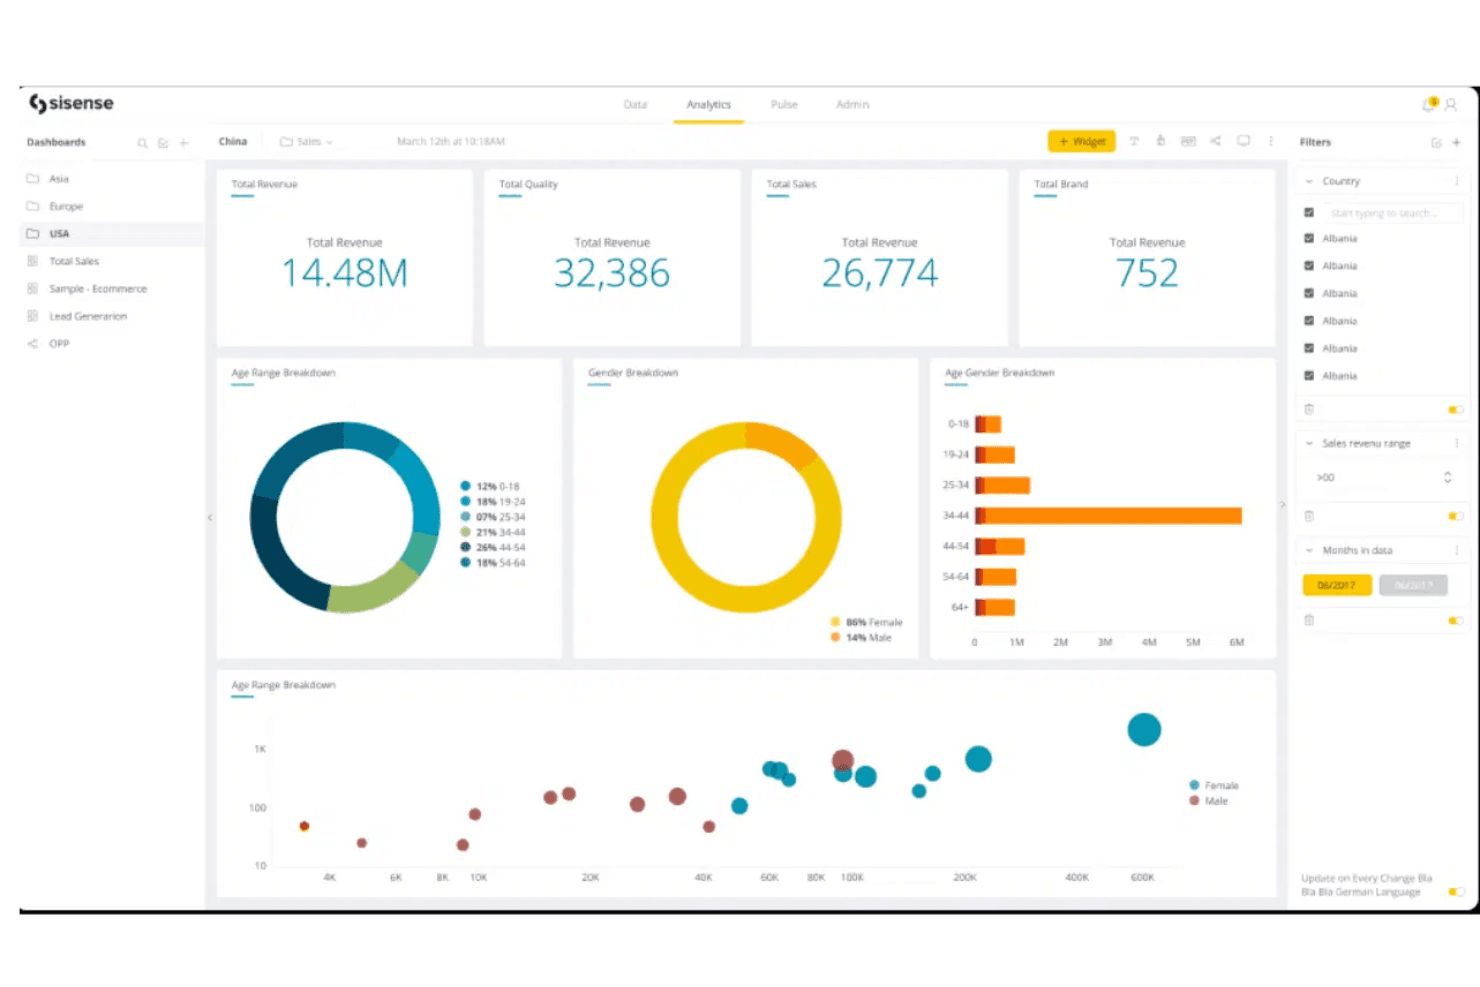
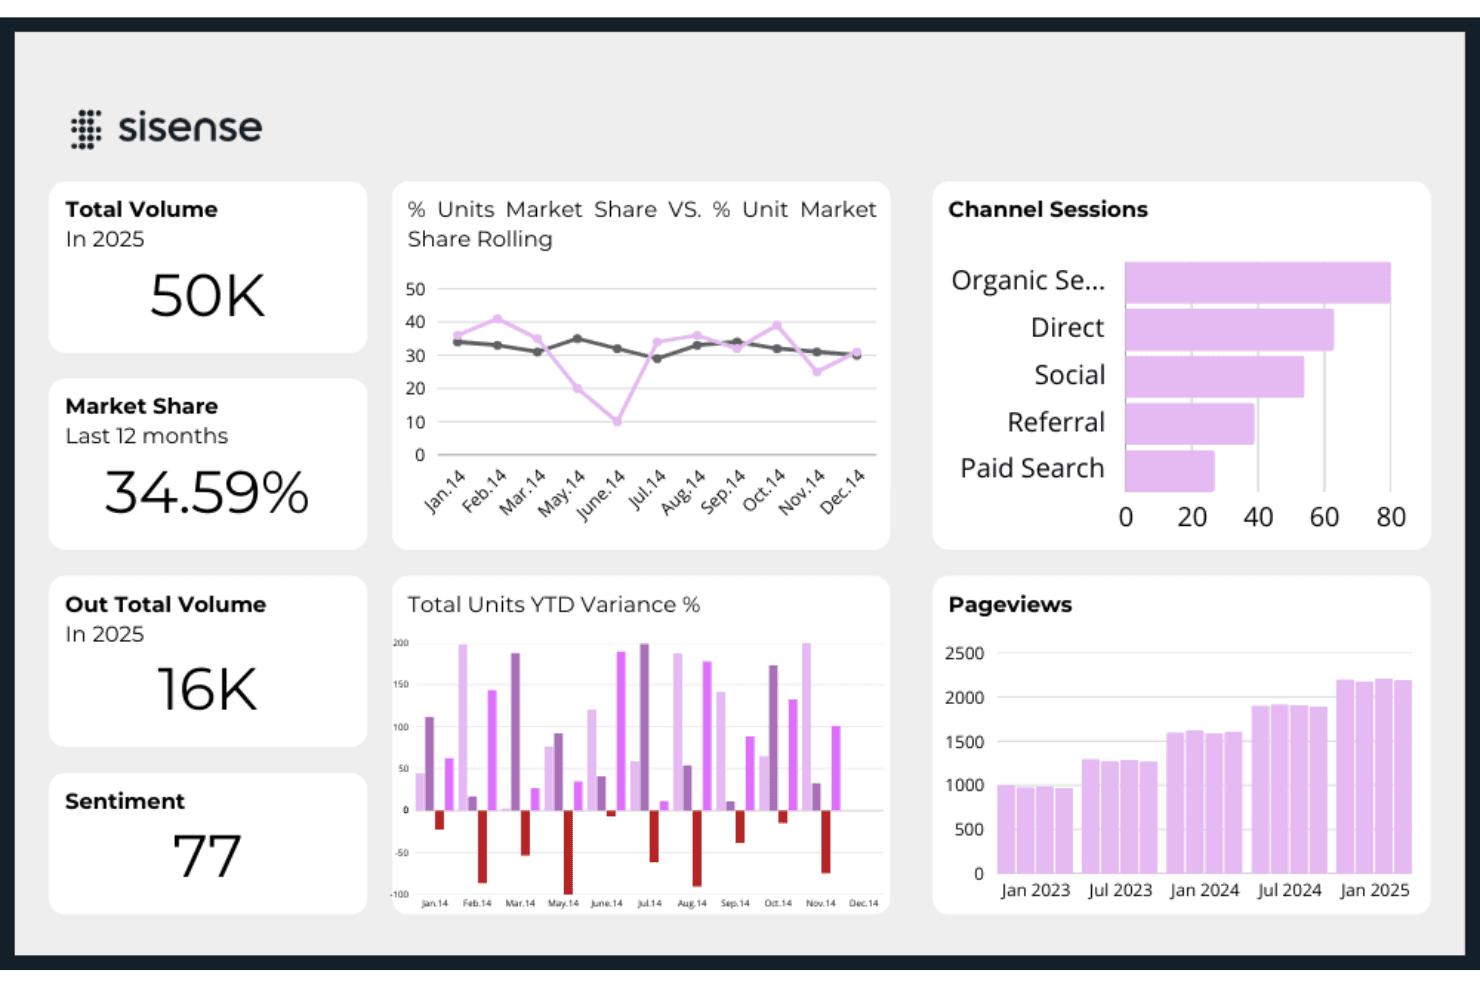
Sisense lets you build dashboards with customizable widgets that update in real time, giving your team instant insights into financial data. You can tailor these dashboards to focus on key metrics.
Data Visualization
The platform offers a range of visualization options that help your team turn complex data into easy-to-understand charts and graphs. This makes spotting trends and making decisions simpler.
Data Integration
Sisense can integrate multiple data sources into a single view using data connectors. This unified perspective ensures nothing gets overlooked.
Ad-Hoc Reporting
You can generate reports on the fly without waiting for IT support, helping automate data analysis and empower your team to get insights whenever they need them.
Real-Time Analysis
Sisense processes data quickly, letting you perform real-time analysis to stay ahead of the curve. This means your team can react to changes as they happen.
Scalability
The software scales with your business, accommodating increasing data loads without sacrificing performance. This makes it a reliable choice for growing companies.
Ease of Use
Sisense is fairly user-friendly, especially with its intuitive interface that lets your team navigate data without much hassle. The drag-and-drop functionality makes building dashboards straightforward, even for non-technical users. However, some users might find the initial learning curve a bit steep, particularly when setting up more complex data integrations. Once you get past the setup, though, using Sisense becomes much easier and more efficient for your team's analytics needs.
Integrations
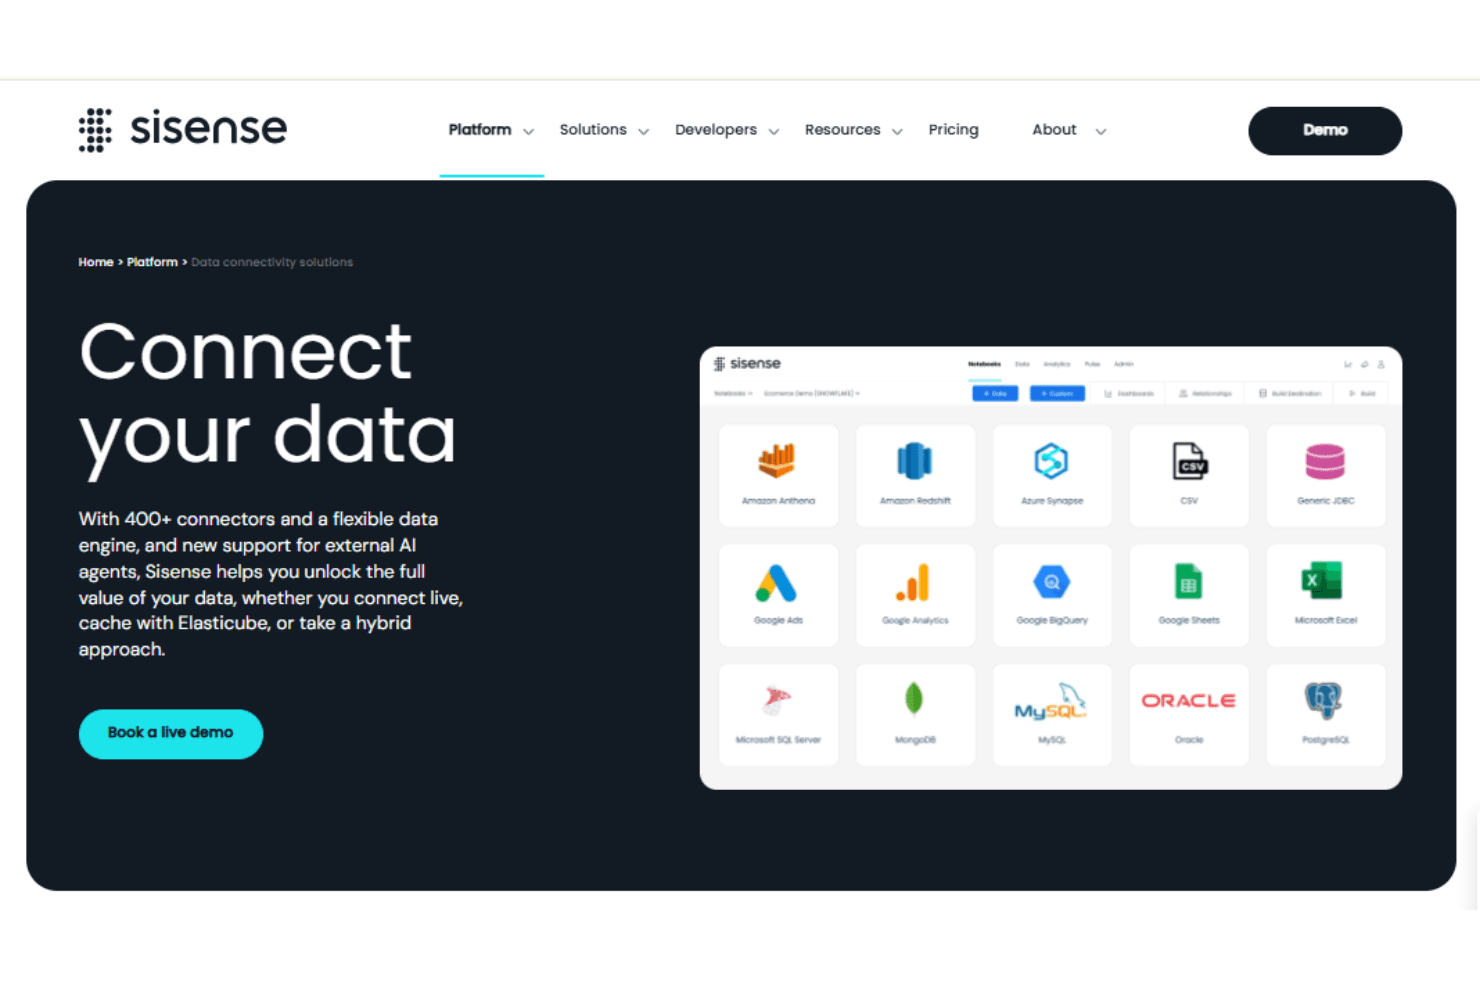
Sisense integrates with SQL databases like PostgreSQL, Microsoft SQLServer, MySQL, MemSQL, and also integrates with data warehouses such as Amazon Redshift and Vertica.
Sisense also has an API and connects with third-party integration tools, whilst allowing developers to extend and customize the platform’s capabilities using Javascript.
Sisense Specs
- A/B Testing: Yes
- Access Management: Yes
- Analytics: Yes
- API: Yes
- Conversion Tracking: Yes
- Custom Reports: Yes
- Customer Management: Yes
- Dashboards: Yes
- Data Export: Yes
- Data Import: Yes
- Data Mining: Yes
- Data Visualization: Yes
- External Integrations: Yes
- Forecasting: Yes
- Inventory Tracking: Yes
- Keyword Tracking: Yes
- Link Tracking: Yes
- Multi-User: Yes
- Notifications: Yes
- Project Management: Yes
- Reports: Yes
- Scenario Planning: Yes
- SEO: Yes
- Supplier Management: Yes
- Visualization: Yes


