

Financial analytics software is a valuable asset for any company. With the right software, teams can gain real-time insights into project health and make informed financial decisions based on comprehensive reporting. However, finding the right financial analytics software can be a challenge, especially with so many options available.
Using my experience with finance and accounting software, I tested and compared several of the top financial analytics software available. From there, I compiled my results into detailed reviews to help you find the best software for your unique needs. I’m confident that you’ll discover your next financial analytics software in the list below.
Why Trust Our Software Recommendations
6,700+
Reviews
20
Industry experts
16+
Evaluation factors
14
Years
Our team has been testing and reviewing software since 2012. As finance leaders ourselves, we know how difficult—and important—it is to choose the right software.
For this guide, we evaluated tools using hands-on testing and independent research, scoring tools using our selection criteria.
Our reviews reflect our human editorial judgment, not a sales pitch.
Best Financial Analytics Software Summary
This comparison chart summarizes pricing details for my top financial analytics software selections to help you find the best software for your budget and business needs.
| Tool | Best For | Trial Info | Price | ||
|---|---|---|---|---|---|
| 1 | Best with AI-powered finance automation agents | Free plan available | Pricing upon request | Website | |
| 2 | Best for Excel-based financial analytics | Free demo available | Pricing upon request | Website | |
| 3 | Best for customizable financial dashboards | Free plan available | From $39/month (billed annually) | Website | |
| 4 | Best for customizable management reports | Free plan + free demo available | From $16/user/month (billed annually) | Website | |
| 5 | Best for real-time financial insights | Free demo available | Pricing upon request | Website |


Best Financial Analytics Software Reviews
Below are my detailed summaries of the best financial analytics software that made it onto my shortlist. My reviews offer a detailed look at the key features, pros & cons, integrations, and ideal use cases of each tool to help you find the best one for you.
 Best with AI-powered finance automation agents
- Free plan available
- Pricing upon request
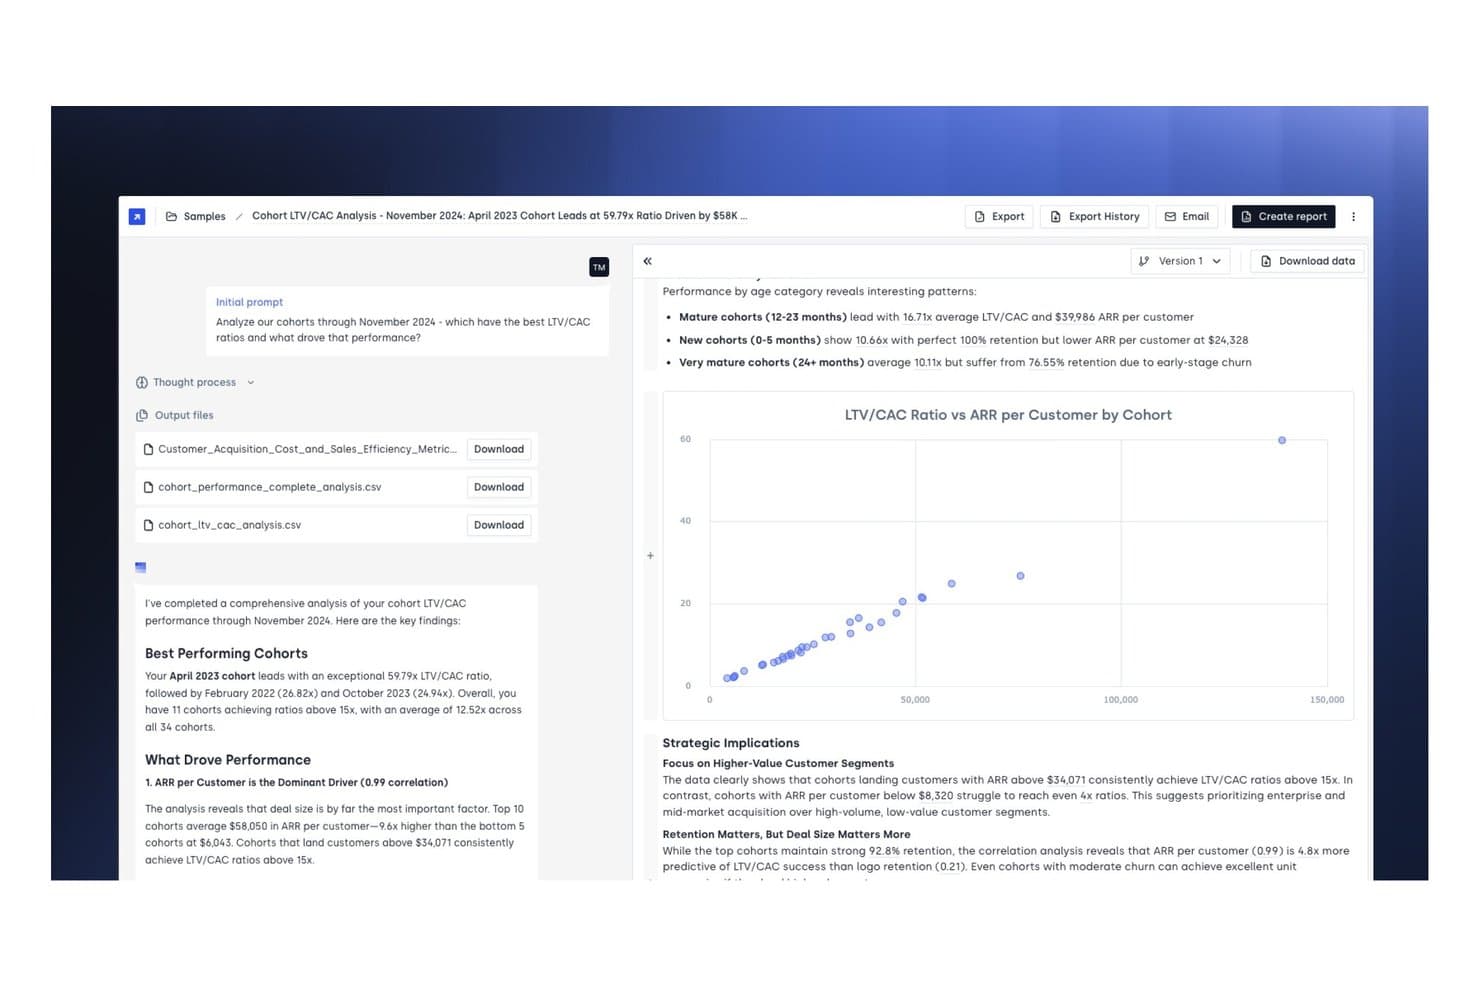
Concourse offers a cohort LTV/CAC analysis dashboard that surfaces performance insights, scatter plot visualizations, and strategic financial recommendations across customer segments. Concourse is an AI agent platform built for corporate finance that automates variance analysis, forecasting, close-cycle reporting, and recurring financial workflows across connected ERPs, data warehouses, and accounting systems.
Who Is Concourse Best For?
Concourse is a strong fit for CFOs and finance leaders at growth-stage and enterprise companies whose teams spend significant time on manual reporting and recurring analysis workflows.
Why I Picked Concourse
Concourse earns its spot as one of the best on my shortlist because its AI agents don't just surface data, they run full workflows end to end. I like the Flux & Variance Agent specifically: it generates automated variance commentary with full source traceability, so every number is defensible down to the transaction level. The Close Agent handles recurring close-cycle reporting autonomously, which means my team gets board-ready outputs delivered to Slack or PowerPoint before anyone has to ask.
Concourse Key Features
- Multi-system ERP and data warehouse integration: Connects natively to Oracle, SAP, NetSuite, Workday, QuickBooks, Sage, Xero, Snowflake, and BigQuery.
- Human-in-the-loop review: Allows finance teams to review, approve, or refine agent-generated outputs before dissemination.
- Custom evals and workflow orchestration: Supports building custom models and workflows that adapt to your organization’s financial rules and controls.
- Audit-ready reporting and full traceability: Provides granular audit trails and lets users trace every reported number back to its source system.
Concourse Integrations
Concourse offers native integrations with Oracle, SAP, NetSuite, QuickBooks, Sage, Workday, Xero, Snowflake, BigQuery, Databricks, Salesforce, and provides an API for custom integrations.
Pros and Cons
Pros:
- Autonomous close reporting saves analyst hours
- Full transaction-level audit trail included
- AI agents automate end-to-end finance workflows
Cons:
- Newer platform with a smaller user community
- Limited self-serve dashboard customization options
Learn more about Concourse: Best for Excel-based financial analytics
- Free demo available
- Pricing upon request
Visit WebsiteCustomer Rating:4.7/5
Datarails automates reporting, budgeting, and forecasting for Excel users. Datarails is a financial planning and analysis (FP&A) software solution designed for Excel users, primarily serving finance professionals like CFOs and financial analysts. It automates data consolidation, financial reporting, budgeting, forecasting, and scenario modeling while allowing users to maintain their existing Excel models and spreadsheets.
Why I picked Datarails: It automates repetitive tasks and enhances data accessibility within a familiar Excel environment, making it easy to generate real-time insights. The platform offers tools for budgeting, forecasting, and scenario modeling, helping your team streamline financial processes.
Datarails also provides robust financial reporting and data visualization features, improving efficiency and strategic insights. You can consolidate data from various sources and access critical KPIs in real-time.
Standout features & integrations:
Features include data consolidation, financial reporting, budgeting, forecasting, scenario modeling, and data visualization. You can automate repetitive tasks and access all financial data in one place. The platform offers AI tools for quick finance requests and management self-service.
Integrations include QuickBooks, Xero, Sage Intacct, NetSuite, Microsoft Dynamics, SAP, Oracle, Salesforce, HubSpot, and Google Sheets.
Pros and Cons
Pros:
- Real-time data drilling
- Built-in visualization tools
- Retains full Excel functionality
Cons:
- Some integration issues with uncommon software
- Dependence on Excel may limit advanced analytics
Learn more about Datarails: Best for customizable financial dashboards
- Free plan available
- From $39/month (billed annually)
Visit WebsiteCustomer Rating:4.8/5
Koyfin offers data and tools to analyze global equities, ETFs, and funds. Koyfin is a financial data and analytics platform designed for investors, financial advisors, and analysts. It offers extensive data coverage and customizable tools to analyze global equities, ETFs, mutual funds, and other asset classes.
Why I picked Koyfin: With Koyfin, you get a customizable interface that lets you tailor your dashboard to suit your needs. It provides live market data and advanced graphing tools to help you analyze stocks and other securities. You can track economic trends, monitor global yields, and get detailed insights on commodities and cryptocurrencies.
Koyfin brings together all the data you need in one place, making investment analysis straightforward and efficient.
Standout Features & Integrations:
Features include customizable dashboards, an equity screener with over 100,000 global securities, and macro dashboards. You can also access powerful graphing tools and live monitoring of global yields from 40 countries. The platform’s interface is also customizable, so you can tailor it to your specific needs.
Integrations include Bloomberg, Refinitiv, FactSet, S&P Global, IHS Markit, Morningstar, Thomson Reuters, MSCI, and ICE Data.
Pros and Cons
Pros:
- Comprehensive equity screener
- Advanced graphing tools
- Extensive data coverage
Cons:
- Can be overwhelming for beginners
- No mobile app
Learn more about Koyfin: Best for customizable management reports
- Free plan + free demo available
- From $16/user/month (billed annually)
Visit WebsiteCustomer Rating:4.6/5
Fathom offers KPI tracking, custom reports, cash flow forecasting, and consolidations. Fathom is a financial analytics software designed for small and medium businesses, accountants, and franchises. It focuses on KPI monitoring, custom management reporting, cash flow forecasting, and financial consolidations.
Why I picked Fathom: Fathom lets you quickly create management reports and automate their delivery. You can perform three-way cash flow forecasts to see future financial scenarios. Group benchmarking helps you compare multiple businesses effortlessly. The software also integrates with major accounting platforms, making it accessible for users without a financial background.
Standout features & integrations:
Features include KPI monitoring, custom management reporting, cash flow forecasting, and financial consolidations. You can automate report delivery and perform detailed three-way cash flow forecasts. Group benchmarking is also available for comparing multiple businesses.
Integrations include QuickBooks, Xero, MYOB, Excel, Google Sheets, and others.
Pros and Cons
Pros:
- Accessible for non-financial users
- Group benchmarking
- Quick report creation
Cons:
- No mobile app
- Limited customization
Learn more about Fathom: Best for real-time financial insights
- Free demo available
- Pricing upon request
Visit WebsiteCustomer Rating:4.4/5
Board offers real-time insights, reporting, budgeting, forecasting, and consolidation. Board’s financial analysis software is designed to enhance financial performance through real-time insights and reliable data. It’s targeted at key industries such as retail, manufacturing, and financial services, offering key business functions like financial reporting, planning, budgeting, forecasting, and group consolidation.
Why I picked Board: The software streamlines financial analysis by offering real-time insights via repeatable reports, improving the communication of budgets and forecasts. It ensures accurate data management with a single source of truth, enabling in-depth financial analysis using embedded analytics and AI. In addition, the platform boasts significant ROI with quick payback periods.
Standout features & integrations:
Features include financial reporting, planning, budgeting, forecasting, and group consolidation. Your team can utilize the platform's real-time insights and repeatable reports to improve budget and forecast communications. The self-service reporting feature means you can create and update presentations easily without needing IT support.
Integrations include Microsoft Office, and other native integrations are supported.
Pros and Cons
Pros:
- Significant reduction in planning time
- Automation of data input
- High finance efficiency
Cons:
- Technical knowledge is beneficial
- Complexity in learning curve
Learn more about Board:
Other Financial Analytics Software
Here are some additional financial analytics software options that didn’t make it onto my shortlist, but are still worth checking out:
- 6JoiinBest for multi-entity consolidation
- 7CoefficientBest for live spreadsheet financial reporting
- 8SlashBest for interactive financial analytics
- 9DualEntryBest for multidimensional reporting
- 10Zoho AnalyticsBest for easy data integration
- 11UpflowBest for cash flow analysis
- 12WorkdayBest for integrated financial and HR management
- 13OneStreamBest for a unified financial platform for enterprises
- 14Vena SolutionsBest for Excel integration in financial planning
- 15NetSuite Analytics and ReportingBest for real-time visibility in financial operations
Related Reviews
How I Evaluate Financial Analytics Software
I split my evaluation into two layers: baseline criteria every tool must meet and the differentiators—like close automation or AI-driven variance analysis—that separate the best from the rest.
Core Functionality (Table Stakes For This List)
When I'm selecting tools for my list, I rank each one on a scale from 0 (does not offer the functionality) to 5 (excels in this area) for each core functionality listed below. Then, I calculate the tool's total score into a percentage. Each tool needs to achieve a minimum total score of 65% to be considered for inclusion.
- Financial Data Integration: I check whether the tool connects natively to major ERPs and GLs like NetSuite, SAP, and QuickBooks, or if teams are stuck manually importing CSVs every close cycle.
- Financial Reporting & Dashboards: Each platform should let you build P&L, balance sheet, and cash flow reports with drill-down into the underlying transactions, not just surface-level charts.
- Budgeting, Forecasting & Planning: I evaluate whether the tool supports rolling forecasts and scenario modeling—for example, letting you compare a conservative hiring plan against an aggressive growth plan side by side.
- Variance & Profitability Analysis: The ability to run actual-vs-budget and period-over-period comparisons across dimensions like department, product line, or cost center is something I look for in every tool.
- Financial KPI & Metrics Library: A good platform offers prebuilt metrics like EBITDA, gross margin, and working capital ratios, plus the flexibility to create custom KPIs tied to your specific chart of accounts.
- Multi-Dimensional Financial Modeling: I look at how each tool handles multi-entity consolidation, multi-currency translation, and hierarchical structures—especially for organizations operating across several subsidiaries.
Once I have a list of tools that meet this criteria, I consider what sets each platform apart.
Differentiating Factors (What Sets Vendors Apart)
Here's how I compare and contrast different vendors:
Standout Features
AI-driven insights are a real differentiator—I look for tools that automatically flag anomalies in spend or revenue trends without manual digging. An Excel-native interface matters because most FP&A teams still build models in spreadsheets, and strong platforms let you work in that familiar environment while pulling from a governed data source. I also evaluate close and consolidation automation, which can shave days off month-end by handling intercompany eliminations and reconciliation workflows within the analytics tool itself.
Beyond Features
ERP ecosystem fit is one of the first things I check—a tool that connects deeply with your core GL or ERP is far more useful than one offering dozens of shallow connectors. Compliance and audit readiness also weighs heavily, especially SOC 2 Type II certification and full audit trails that external auditors can trace back to source transactions. I also evaluate implementation timelines, since finance teams on tight close cycles can't afford months of deployment before seeing results.
How to Choose Financial Analytics Software
It’s easy to get bogged down in long feature lists and complex pricing structures. To help you stay focused as you work through your unique software selection process, here are several important factors to keep in mind:
| Factor | What to Consider |
| Scalability | Will this software grow with your business needs? |
| Integrations | Does it connect with your current systems (i.e. CRMs and ERPs)? |
| Customizability | Can you tailor it to fit your specific workflows? |
| Ease of Use | Is it user-friendly for you and your team? |
| Budget | Does it align with your financial constraints? |
| Security Safeguards | Does it provide robust protection for your data? |
Keep these factors in mind to ensure your software selection process stays organized and focused.
Trends in Financial Analytics Software
In my research, I sourced countless product updates, press releases, and release logs from different financial analytics software vendors. Here are some of the emerging trends I’m keeping an eye on:
- Natural Language Processing (NLP) in Financial Analysis: NLP helps users interact with financial data using conversational language. This makes data analysis accessible to non-technical users. Vendors like Infosys BPM are integrating chatbots and digital assistants to provide real-time financial insights.
- Scenario Planning and Simulation: Tools are increasingly offering advanced scenario planning features. These allow businesses to model different financial outcomes based on varying assumptions, helping in strategic decision-making. StratifyTech has highlighted this as a crucial trend in FP&A tools.
- Real-Time Data Integration: The demand for real-time data dashboards is growing. Financial analysts need to access updated information instantly to make informed decisions. Companies like Netguru are emphasizing this feature in their latest software solutions to help speed along the consolidation and close processes.
- Enhanced Data Security Measures: With growing cyber threats, financial analytics tools are incorporating stronger data security protocols. Cybersecurity mesh architecture is becoming popular to protect sensitive financial data. RIB Software has noted this as a key trend in business intelligence tools.
- AI-Driven Insights and Automation: Generative AI and machine learning algorithms are being used to automate complex financial analyses and provide predictive insights. IBM has pointed out that generative AI advancements are significantly impacting financial analytics.
What is Financial Analytics Software?
Financial analytics software is used to analyze datasets and gain actionable insights into a company's financial performance. Financial professionals, such as analysts, accountants, and CFOs, generally use these tools to make informed decisions based on data.
These tools help users by providing a comprehensive view of their financial services data, enabling better forecasting for statements and performance improvement. Features like real-time reporting, budget tracking, and financial forecasting help with visualizing data and making strategic decisions.
Overall, these tools offer significant value by enhancing decision-making and improving financial outcomes.
Features of Financial Analytics Software
When selecting financial analytics software, keep an eye out for the following key features:
- User-friendly interface: Provides easy navigation, allowing users to access different sections without needing extensive accounting knowledge.
- Custom dashboards: Offers customizable dashboards that visually represent data, helping users focus on key insights and trends.
- Integration capabilities: Enables integration with other tools, such as QuickBooks or other financial management tools, for automatic data import and export in various formats.
- Statistical data analysis support: Facilitates the interpretation of financial data, enabling key stakeholders to extract actionable insights.
- Research and investigation tools: Assists in market research, competitor analysis, risk management, and understanding customer needs for better decision-making.
- Comparative reporting: Generates comparative reports to evaluate business performance against competitors and track progress over time.
- Cloud computing support: Provides cloud-based access, allowing users to work from anywhere without the need for software installation.
- Real-time reporting: Offers real-time insights, enabling quick decision-making based on current data for consolidation and close processes.
Benefits of Financial Analytics Software
Implementing financial analytics software can provide several benefits for your team and your business. Here are a few benefits you can look forward to:
- Improved decision-making: Access to real-time financial data and comprehensive reports helps your team make informed decisions quickly.
- Enhanced forecasting: Advanced forecasting tools allow for better prediction of future financial outcomes based on historical data.
- Cost management: Track project budgets versus actuals to keep an eye on spending and identify areas where costs can be reduced.
- Scenario planning: Create and analyze different financial scenarios to understand the potential impact of various business decisions.
- Resource allocation: Allocate resources efficiently by understanding the financial implications of resource utilization.
- Profitability tracking: Monitor the profitability of projects and business units to ensure financial goals are being met.
- Regulatory compliance: Ensure your business meets financial reporting standards and regulatory requirements with accurate and timely data.
Costs and Pricing of Financial Analytics Software
Selecting financial analytics software requires an understanding of the various pricing models and plans available. Costs vary based on features, team size, add-ons, and more. The table below summarizes common plans, their average prices, and typical features included in financial analytics software solutions:
Plan Comparison Table for Financial Analytics Software
| Plan Type | Average Price | Common Features |
| Free Plan | $0 | Basic analytics, limited data storage, and community support |
| Personal Plan | $15-$30 per user, per month | Advanced analytics, custom reporting, and email support |
| Business Plan | $50-$100 per user, per month | Team collaboration features, enhanced security, and premium support |
| Enterprise Plan | $200-$500 per user, per month | Full customization, dedicated account manager, advanced integrations, and SLA |
A breakdown of financial analytics software plan types and their costs and features.
Financial Analytics Software FAQs
Here are some answers to common questions about financial analytics software:
What software does a financial analyst use?
Financial analysts often use tools like Microsoft Excel, SQL, Python, and Tableau. These tools help in retrieving, analyzing, and visualizing financial data. Your team might also rely on specialized platforms like Bloomberg Terminal or FactSet for more advanced market data and analytics.
Which software tools are commonly used for financial analysis?
For financial analysis, tools like the Balance Sheet, Income Statement, and Cash Flow Statement are essential. These documents help you assess a company’s operational and financial performance, aiding in key decision-making processes.
What are the most commonly used reports for financial analysis?
The most commonly used reports for financial analysis include comparative statements, common size statements, trend analysis, ratio analysis, funds flow analysis, and cash flow analysis. Combining analytics capabilities with these financial statements can help you understand different aspects of your company’s financial health and performance.
What are the top software skills for a financial analyst?
Top software skills for a financial analyst include proficiency in Microsoft Excel, SQL, Python, and specialized financial modeling software. Knowledge of accounting software like QuickBooks or ERP systems like SAP can also be beneficial.
What’s Next:
If you're in the process of researching financial analytics software, connect with a SoftwareSelect advisor for free recommendations.
You fill out a form and have a quick chat where they get into the specifics of your needs. Then you'll get a shortlist of software to review. They'll even support you through the entire buying process, including price negotiations.