What’s a Customer Engagement Score? (+ How To Calculate)

Tracking your customer engagement score (CES) is mission-critical. A low CES score is a leading indicator of higher churn and stagnating top-line growth.
Play your cards right, and you’ll be able to prevent a sharp increase in churn, a decrease in monthly recurring revenue (MRR), and a cash crunch.
In this article, I’ll explain the meaning of customer engagement score, how to calculate it, and what it means for your SaaS company’s financial position.
What Is Customer Engagement Score (CES)?
Customer engagement score (CES) is a metric used to measure customer engagement for an existing customer or trial user. CES is calculated separately for every customer and expressed as a number between 1 and 100.
Monitoring CES helps you prepare for potential increases in the churn rate. According to Recurly Research, the average churn rate is 5.57%.
Of course, there’s no single churn rate that’s good for all SaaS companies. The churn rate can vary significantly depending on your industry and the stage your business is in. But if your churn rate is a lot higher than the average of your peers, it’s worth looking at your CES to see if engagement is the culprit.
What Is Customer Engagement In SaaS?
SaaS customer engagement involves strategically managing customer interactions with the SaaS product.
The goal? To show prospects and users the value of the product.
Remember that the definition of engagement varies based on the type of SaaS product. A user will log into a task management app every day. But they might log into an invoicing tool only once a month.
Here are examples of tactics you can use to increase customer engagement for a SaaS:
- Offer upgrade offers to trial users.
- Email tips, guides, and videos explaining advanced features to users to increase adoption.
- Offer customers with high CES referral incentives and upsell offers.
- Request customers nearing subscription renewal to fill out a customer satisfaction survey. This customer feedback will help you optimize various parts of your customer engagement strategy, like the onboarding process and customer support.
Why Does CES Matter?
A high CES for SaaS indicates high engagement and customer lifetime value (CLV or LTV). A high CES also indicates increased profitability and cash inflow, assuming everything else remains constant.
If you work in finance at a SaaS startup, you already know that cash flow can be tricky. Poor customer engagement can lead to a double whammy when it comes to cash flows:
- You lose revenue from existing users as churn increases.
- You’re forced to spend more on acquiring new customers to make up for lost customers.
Customer acquisition costs (CAC) can go as high as $14,772, depending on the industry and the type of customers you want to acquire.
And depending on your SaaS pricing, the CAC payback period can be months or even years. So it will be a while before any new users you acquire contribute to your bottom line.
Here’s a simplified chart explaining the relationship between CES, churn, and total CAC:
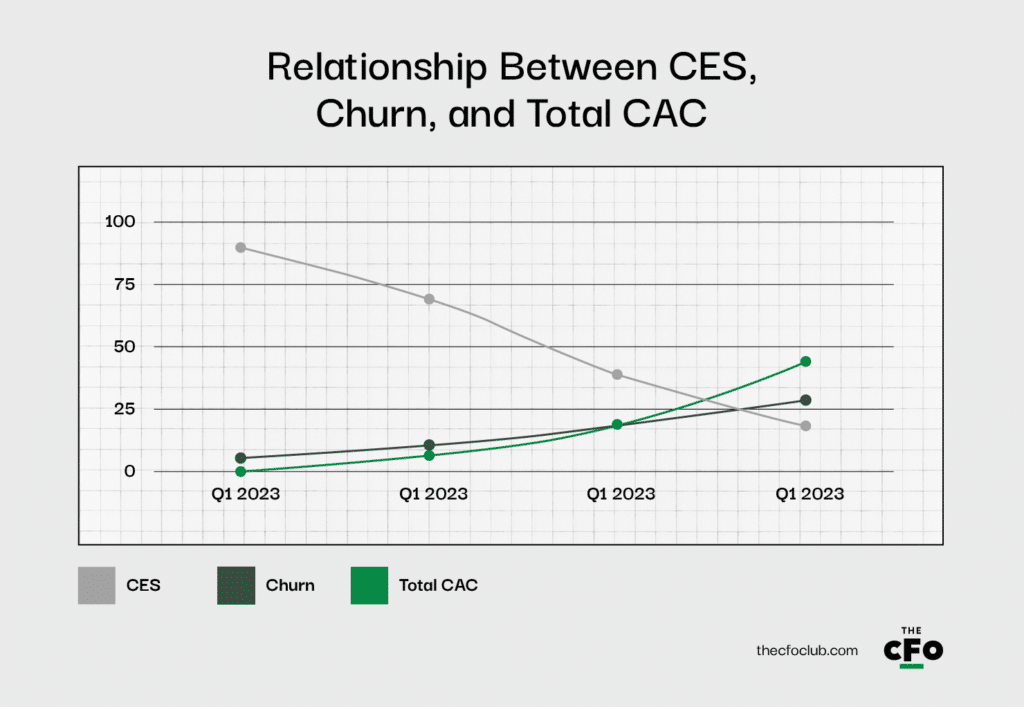
A drop in average CES can increase churn and total CAC.
Notice how, as CES drops and churn increases, the total CAC might increase at a faster pace.
This is because you’ll continue to spend what you’ve been spending on acquisition while spending extra to cover for lost customers.
Of course, this is true under the assumption that you do spend more to try to gain more customers over time.
Monitoring CES
Tools like Salesforce help track customer engagement scores. Many tools also let you set up custom metrics to monitor engagement.
In a perfect world, your CES would be 100. But anything above 70 is generally considered decent. I say “generally” because the CES benchmark might be different for your industry.
Monitoring your CES helps:
- Identify customers with low engagement: To identify reasons for low engagement, request customers with low CES to take a quick survey for insights on specific areas where you can improve. Don’t be discouraged if response rates are low in this demographic; after all, you’re asking someone that doesn’t use your product often to spend some more time thinking about your product!
- Predict the direction of the churn rate over the next quarter or year: Low engagement is highly correlated with higher churn rates. Churn can spell trouble for your bottom line and cash flow.
- Prepare for financial emergencies: If you’re already facing cash flow problems or plan on raising capital, a reduction in revenue and profitability can put you in a tough spot. It’s always good to have short-term financing options available for your SaaS company, like an MRR line of credit, to help you get through a rough patch.
How To Calculate CES
Calculating CES involves estimation, so it’s not always intuitive. Also, the calculations look a bit different for every SaaS industry.
Here’s a general step-by-step process for calculating CES:
Step 1: List Engagement Events
Engagement events are user actions that count as engagement for your product.
The term engagement is subjective. For example, product usage frequency is a critical engagement event for a task management app. But for invoicing tools, you’ll need to use a more reliable engagement event like subscription renewals or upgrades.
If you’re confused about which user actions should be considered engagements for your product, ask yourself: what actions will an active user take?
For example, if you run an FP&A SaaS, engagement events could include:
- Login frequency
- Number of reports generated
- Data upload frequency
Step 2: Track Engagement Events
Now that you have a list of engagement events, you need to put a number on them.
Tracking these events will give you insights into engagement at every stage of the prospect or customer journey.
Use software to create custom engagement events and track them.
Step 3: Assign Weights to Engagement Events
Not all engagement events accurately represent engagement. That’s why we assign weights to these events before calculating the CES. Higher weights represent greater relevance.
Even when a user uses the app daily, it doesn’t necessarily mean they’re engaged. On the other hand, users who recommend your product to colleagues are more likely to be engaged.
So it makes sense to assign login frequency a lower weight than recommendations.
Step 4: Calculate the Customer Engagement Score
Once you’ve quantified the engagement events, plug them into the following CES formula:
CES = Value for event 1 + Value for event 2 + ... + Value for event n
Let’s use an example of an FP&A SaaS to illustrate how the calculation works. For simplicity, we’ll limit the calculation to three engagement metrics.
Here’s the data for Sam and Paul, customers of the FP&A SaaS product:
| Event | Sam | Paul |
|---|---|---|
| Monthly login frequency | 25 | 15 |
| Number of reports generated | 10 | 5 |
| Data uploading frequency | 10 | 5 |
Here are the weights based on how accurately these events reflect engagement:
- Monthly login frequency: 1
- Number of reports generated: 5
- Data uploading frequency: 4
So the CES for each user will be:
| Sam | Paul | |
|---|---|---|
| Calculation | (25 * 1) + (10 * 5) + (10 * 4) | (15 * 1) + (5 * 5) + (5 * 4) |
| CES | 115 | 60 |
How To Use CES
Here’s some context on how to interpret these scores:
- Score between 1 and 40: Very disengaged
- Score between 41 and 70: Somewhat disengaged
- Score between 71 and 100: Highly engaged
- Score above 100: Power users
According to these benchmarks, Sam is a power user, while Paul is somewhat disengaged. It would be worth your while to understand the reasons for Paul’s disengagement.
Ideally, you want more customers like Sam because they help keep the total CAC under control, have a higher LTV, and generate more consistent cash flows.
Let’s use an (overly simplified) example to see how you can interpret and use CES. Suppose the distribution of CES for your user base of 100 customers looks like this:
- Score between 1 and 40: 10 users
- Score between 41 and 70: 40 users
- Score between 71 and 100: 30 users
- Score above 100: 20 users
Your startup SaaS has a single pricing tier—$100 per month (which translates to a monthly revenue of $10,000). Your current monthly expenses, including salaries, hosting, and depreciation, are $6,000. That leaves you with $4,000 (or 40%) in net income.
Now, the problem? You’ll continue to incur most of these costs even if those 10 customers with CES between 1 and 40 don’t renew.
When those 10 customers don’t renew, you lose $1,000 worth of revenue.
Your revenue drops 10%.
Your net income drops 25%.
The median sales and marketing spend for equity-backed SaaS companies is 47% of revenue. If you’re equity-backed, you’ll likely struggle to reserve enough cash to plow back into the business after spending on sales and marketing, general and administrative expenses, and DevOps.
Lower profitability adversely impacts valuation. Lower cash reserves increase the need for capital.
I’d call that a tough spot, wouldn’t you?
How To Improve A Low Customer Engagement Score
In case low CES is becoming a problem for you, here are some tips to improve CES across segments.
- Here’s what you can do to improve a score below 40:
- Personalize and gamify the in-app experience to improve the overall customer experience.
- Add a walkthrough for first-time users, build an extensive knowledge base, and create a customer success center.
- Build your online presence and share your brand voice.
These strategies are a great starting point for the marketing and UX teams to improve CES. Various other strategies, like user surveys and AI-powered chatbots, can help as well.
- Here’s what you can do to improve a score between 41 and 70:
- Survey users in this category to find their pain points and address them.
- Identify features that will allow these users to use your product more effectively and efficiently, and communicate these to users via prompts or knowledge base.
- Use cohort analysis to identify the commonalities between the types of customers in this segment.
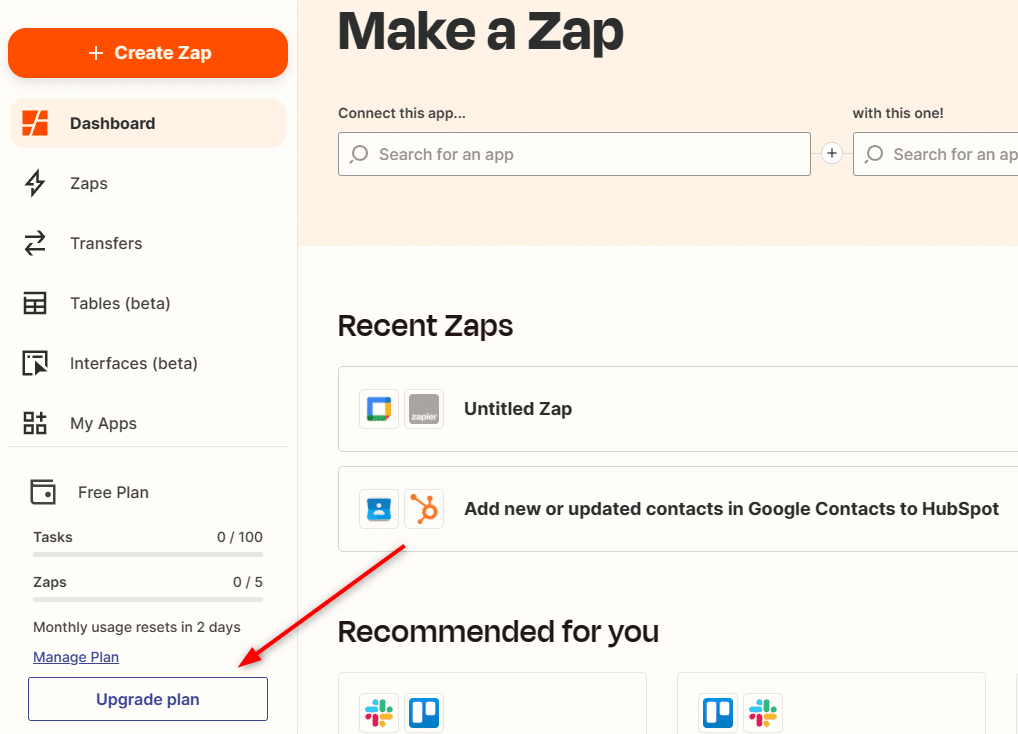
- Here’s how you leverage a high customer engagement score of 70 and above:
- Make upgrading as easy as possible—Zapier does this by placing the option to upgrade on the homepage.
- Upsell and cross-sell using free trials for the upgraded version or add-ons.
- Add contextual upgrade prompts that explain to users the benefits of upgrading.
Your goal with users in this segment is to increase their lifetime value. Since these users are already engaged, they’re more likely to upgrade than users with a lower CES.
Customer Engagement Metrics
CES isn’t the only engagement metric. Looking at other engagement metrics gives you a more holistic view. Here are some other user engagement metrics you should track:
- NPS (Net Promoter Score): NPS is a measure of customer loyalty. indicates the likelihood of a user recommending your product to others on a scale of 1 to 10. You’ll need to survey current users, asking them how likely they are to recommend your product, so calculating NPS comes with a cost.
- Freemium to premium conversion rate: The higher the number of users who switch from a free to a paid version, the better your customer engagement (and the better off your business is!).
- Customer retention rate: The longer your users keep using your product, the more engaged they’re likely to be.
- Customer satisfaction score (CSAT): CSAT is a survey-based metric like NPS where users are asked how satisfied they are with the product. Engaged users are generally more satisfied.
- Bounce rate: The bounce rate tells you how engaging your web pages are. When a user only visits a single page and “bounces” without visiting anything else, your bounce rate increases. The bounce rate is calculated by dividing single-page visits by total visits (sessions).
Poor Engagement Has Financial Repercussions
Improving engagement isn’t the finance team’s responsibility. But since engagement has a financial impact, it’s important to keep an eye on the CES, especially when you’re a young SaaS company still in the process of building financial fortitude.
If you found this post insightful, subscribe to The CFO Club newsletter to receive these insights in your inbox.
