20 SaaS Growth Metrics You Need To Monitor To Succeed

Are your DBS scores exceeding industry standards? Does your NRI rate align with your team’s OPIs? How’s your NTS-to-CRA ratio?
Confused yet? Good, because those were all made-up metrics.
But for SaaS leaders, there are many very important, very real SaaS growth metrics to be aware of and to track continually.
SaaS growth metrics allow leaders to ensure company performance is on the right track, standardize internal metrics to compare with competitors, and improve outcomes when seeking funding.
This guide will set the record straight, covering the key metrics that you need to focus on as a financial leader at a growth-stage SaaS firm.
Why Track “SaaS Metrics”?
SaaS is a bit of a different ballgame, where many of the written and unwritten rules of business don’t necessarily apply.
If you go by the book (with “the book” being business school textbooks), SaaS firms can look like a hot mess. Massive burn rates, high customer acquisition costs, anemic margins at the startup stage… the list goes on.
Much of this boils down to a simple truth: In SaaS, growth is often the most important metric. Profitability may not come for many years.
2023 will be Twilio’s first profitable year by non-GAAP standards, despite being in business since 2008. It took Salesforce 4 years to reach profitability. And many popular brands, like Spotify and Slack, have never turned a profit.
In performance monitoring, and even valuation, growth is king for SaaS companies. A 2022 analysis found that growth was 2.5x more important than profitability when it came to public SaaS firm valuations.
While getting SaaS funding is certainly harder than it was a few years ago, growth is still a primary driver of valuation and investor interest. Whether you’re trying to woo investors or smash internal targets, focusing on growth is key.
Growth isn’t everything, of course — particularly in this interest rate environment. Metrics like the Rule of 40 even try to balance the roles of growth and profitability.
But ultimately, growth is still king — and being able to track, analyze, and standardize that growth is vital.
Metrics To Measure
If you thought 101 Dalmatians was a lot, wait until you find out how many different SaaS metrics there are… So the question becomes: As a CFO, what matters most to your business model?
Most of these metrics are relevant to SaaS firms at just about any stage. However, the SaaS growth metrics below are categorized in order of importance, with a focus on US-based, growth-stage SaaS firms with ARR between $5 and $20m.
Customer Lifetime Value
Customer lifetime value (CLV, sometimes noted as LTV) is the total revenue produced by an average customer over the expected lifetime of the business relationship. It reflects initial and ongoing purchases/revenue.
CLV can be calculated on a historical basis or a predictive basis. Both are very important metrics to track and analyze, as they provide a baseline revenue estimate for each new customer acquisition — a statistic that is vital to know for a variety of strategic resource allocation decisions.
There’s no standard “good” CLV. For a high-ticket B2B SaaS product, it could be in the hundreds of thousands of dollars, or just a few hundred dollars for consumer-facing apps. It’s more about the ratio of CLV to customer acquisition costs and other key metrics, which I’ll discuss more below.
Customer Acquisition Cost (CAC)
This one is pretty self-explanatory: CAC is simply how much it costs, on average, to acquire a new customer. This includes direct costs, like ad spend, and indirect costs, like marketing/sales staff salaries and marketing software subscriptions.
Keeping CAC levels reasonable is particularly important now that SaaS investors have moved past the “growth at all costs” mindset (at least, for now). Investors are no longer throwing money around at anything with a high growth rate; they want sustainable growth.
Again, there’s no clear “good” CAC to aim for; it depends on other metrics like your ARPU and CLV.
CLV/CAC Ratio
The CLV/CAC ratio compares customer lifetime value to customer acquisition cost. Or, simply, how much revenue each customer brings in vs. how much it costs to obtain that customer.
This might be the most important SaaS growth metric to understand and track over time. It’s a key way to understand the sustainability of your growth tactics.
A good CLV/CAC ratio is considered around 3:1 or greater. A ratio of 3:1 would mean a scenario where a customer produces $3,000 in lifetime value and costs $1,000 to obtain.

Monthly Recurring Revenue (MRR)
Okay, you know this one. But it’s vital nonetheless, and a metric that every SaaS professional should have in mind.
MRR is calculated with the following formula: Total number of paying users X average revenue per user (ARPU).
MRR (and its cousin annual recurring revenue, or ARR) is the primary metric that SaaS firms use to track revenue growth over time.
Annual Recurring Revenue (ARR)
ARR is simply MRR x 12. So why bother?
Well, ARR can provide a zoomed-out view of growth over time. While MRR can be volatile and shift quickly (particularly in high-growth stages), ARR is a bit more stable and helpful in identifying long-term trends.
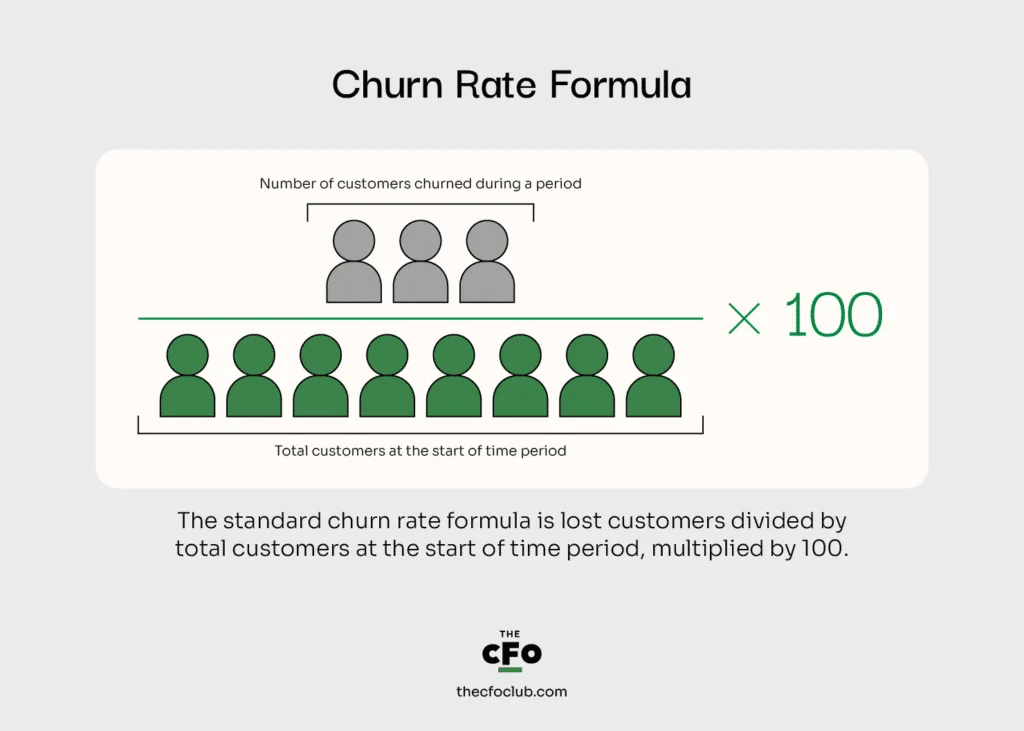
Customer Churn Rate
Churn rate is a measure of customer attrition. It looks at the percentage of customers who cancel or stop using a SaaS product over a given period of time (usually one month or one year).
Monitoring churn rates helps CFOs better understand customer pain points, where offerings may be falling short, and the impact on customer acquisition cost and other metrics. Paying close attention to churn rates is vital to influencing customer retention strategy.
A good SaaS churn rate is typically in the ballpark of 5% annually or less, though this can vary by market segment.
Revenue Churn Rate
Another way to examine churn is to look at the revenue churn rate, which measures things in dollar terms rather than user/customer terms. Revenue churn rates measure the revenue lost due to customer churn in a given period.
Because revenue churn directly measures the financial impact of attrition, it’s particularly helpful for financial forecasting and budgeting purposes.
Customer Retention Rate
Customer retention rate is another way to look at how many customers are staying or leaving your product over a given period of time. In this case, it measures the percentage that’s sticking around, usually over a 1-year period.
I prefer customer churn rate vs. retention rate for a number of reasons, though both are helpful. Churn rates look at a snapshot in time, while retention rates show how well you’re engaging users over the course of their relationship with your service.
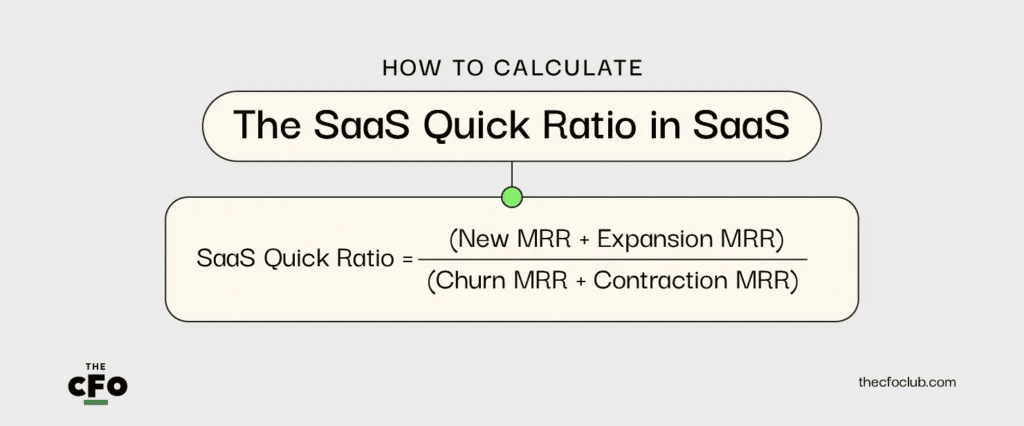
SaaS Quick Ratio
The SaaS quick ratio helps leaders analyze the relationship between revenue growth and customer retention. It’s helpful in determining if your acquisition of new customers is balanced with the retention of existing customers.
The SaaS quick ratio is helpful for a number of reasons, not least of which is that it prevents problematic metrics (like a high churn rate) from being swept under the rug.
A firm with a rapidly expanding MRR may be okay with an exceptionally high churn rate, simply because growth outweighs churn. But what happens when growth slows, the market saturates, or a competitor butts in?
Examining the SaaS quick ratio on a regular basis helps bring balance and identify (relatively) small problems before they become dumpster fires.
Lead-to-Customer Rate
The lead-to-customer rate, AKA customer conversion rate, is just what it sounds like: The percentage of leads that sign up for a paid plan. This could be paid conversions of qualified leads (i.e. newsletter signups, demo requestees, etc.) or conversions from free trial users (though this is also measured separately as the “trial conversion rate”).
The implications of customer conversion rates are obvious. Rates can inform marketing messaging, copywriting strategy, landing page optimization, and traffic source evaluation, among other things.
Gross Margin
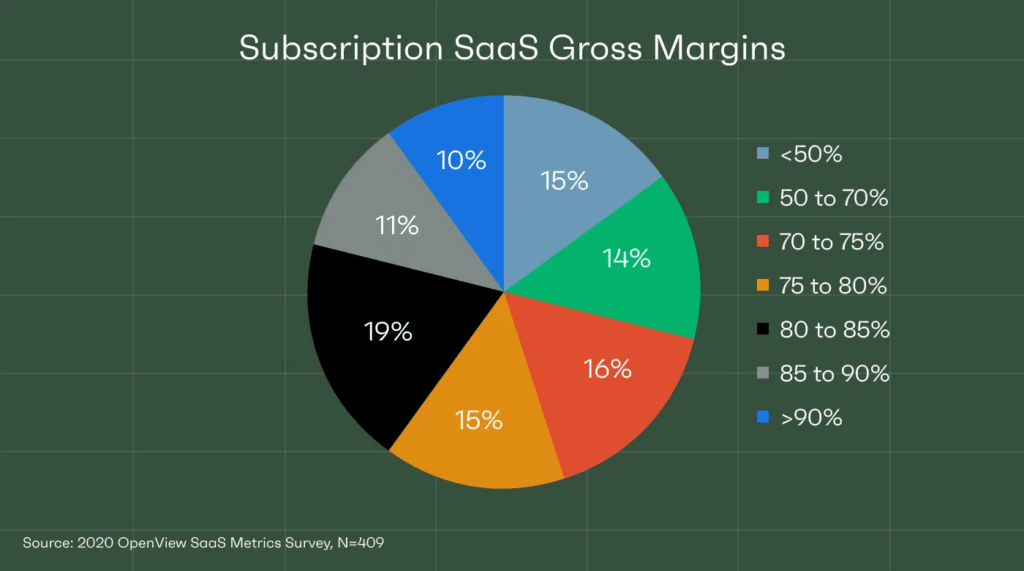
Okay, this one’s certainly not unique to SaaS firms, but it’s a vital metric nonetheless. Margins are important to all businesses, and SaaS gross margins are typically expected to be higher than in most other industries.
In fact, a “good” SaaS gross margin is often considered to be 70%+. A 2020 study found that 70% of the 400+ companies surveyed had margins of 70% or greater, and top performers had margins exceeding 80%.
Examining gross margins — and comparing them to industry standards — can help inform pricing strategy, align growth strategy with overall targets and business priorities, and even help secure funding.
Average Revenue Per User (ARPU)
Average revenue per user (ARPU), or average revenue per account (ARPA), are pretty self-explanatory. These SaaS growth metrics are useful for evaluating financial performance and tracking changes over time.
These metrics are also useful for SaaS cohort analysis — aka digging into data on specific segments of your customer base.
The Rule of 40
The Rule of 40 is a SaaS-specific metric or “rule” that attempts to judge early- and late-stage companies equally by balancing growth and profitability. It states that a firm’s annual growth rate plus its profit margin should be 40% or higher.
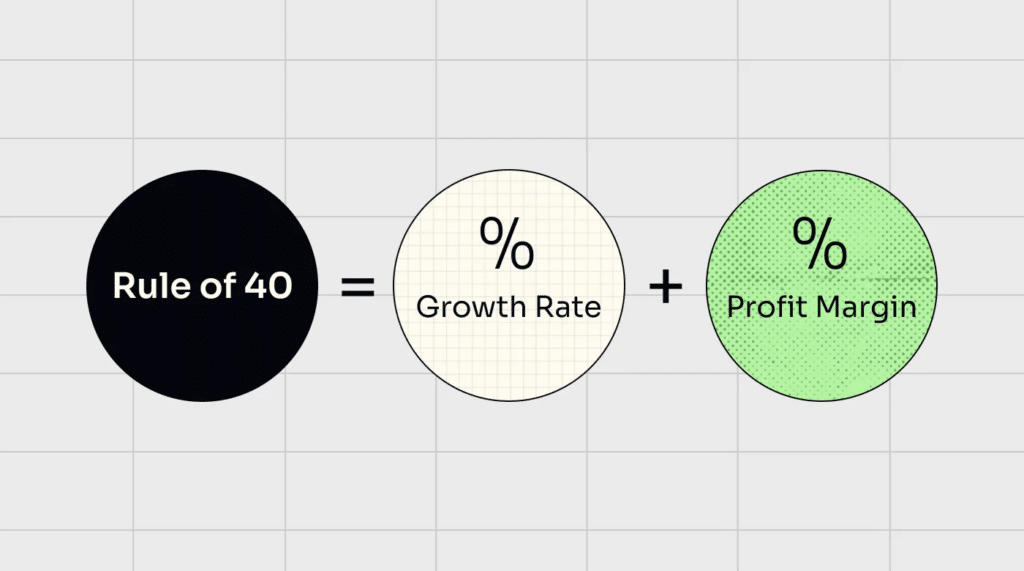
This rule can help standardize performance metrics across different stages of growth and market segments. A wide variety of situations can “pass” the Rule of 40: For instance, a firm with a 30% growth rate and an 11% profit margin would pass, as would a firm with a 50% growth rate and a -9% profit margin.
There are some big criticisms of the Rule of 40; most notably, that it’s not sustainable in the long run. Only 16% of firms in one survey passed the Rule of 40, despite being relatively successful SaaS companies.
But it’s still a useful metric to consider, particularly if you go about the Rule of 40 calculations properly and avoid common pitfalls.
Expansion Revenue/Expansion MRR
Expansion MRR looks at monthly recurring revenue increases from existing customers. This includes existing paying customers adding on services or upgrading plans, as well as freemium users upgrading to paid plans.
Expansion MRR is useful to measure because it gauges how well you’re engaging existing customers to upsell and expand. For firms serving enterprise customers, in particular, a substantial portion of MRR growth can come from expansion MRR.
This metric can also help inform your sales team’s focus; introduced 5 new products in the last year but have minimal expansion MRR? Time to double down on existing accounts.
CAC Payback Period
The CAC payback period measures the time it takes for your company to recover what you spent to acquire a customer, from that customer. If a new account costs $900 to obtain and pays $100 per month for a subscription, the CAC payback period is 9 months.
A good CAC payback period is generally considered to be 12 months or less.
Activation Rate
Activation rate examines the percentage of users that reach a certain predetermined milestone.
This could be any metric that your team deems important: 20 hours using the platform, 6 months of membership, 100 widgets created, etc.
Activation rate looks beyond sign-ups (and even beyond revenue creation) to gauge how well users are engaging with your platform. Therefore, while not being the most important metric for external validation of your company, the activation rate is important to understand for customer success and retention strategies.
Trial Conversion Rate
If your product offers a free or discounted trial, the trial conversion rate measures the percentage of customers who go on to a paid membership.
A good trial conversion rate may be in the range of 20-25%, though this depends on the product price point and market segment.
Your trial conversion rate can inform promotion and pricing strategy, as well as how effective the trial offer itself is.
Customer Engagement Score
The customer engagement score is a per-user measure of customer engagement, with a numerical rating between 1 and 100. A user with a score of 5 would be very unengaged — barely using the product, and likely to cancel. A user with a score of 90 would be highly engaged and considered a super-user who is likely quite happy with the product.
Customer engagement scoring is calculated separately for each customer; it’s not a broad customer base metric. Because of this, it’s incredibly helpful for upselling, increasing engagement, and ultimately achieving greater customer success and retention rates.
Net Promoter Score (NPS)
Net promoter score is a measure of customer loyalty and satisfaction. It indicates the likelihood of a customer recommending the product to someone else, on a scale of 1 to 10.
You’ve likely received customer surveys yourself, asking you this very same question: “How likely are you to recommend [Jim’s Burger Barn] to your friends and family?” You get these emails all the time because they provide valuable feedback for companies — though they require manual surveying, so this can be a costly figure to calculate.
Number of Active Users (NAU)
Another self-explanatory metric, but an important one nonetheless. NAU is typically considered the number of daily users, though “active” may be defined differently by different teams.
Ultimately, this is an internal metric that can help teams gauge the growth of engaged customers, rather than just total customer or user growth.
Metrics Are What You Make Them
In the SaaS business, competition is fierce. Everyone wants to compare performance to externals — but really, most of these SaaS growth metrics are best used on an internal basis to monitor progress, tweak strategy, and ultimately work towards business objectives.
Want more valuable insights on financial leadership and strategy in the SaaS industry? Subscribe to The CFO Club Newsletter today.