Financial Forecasting Models: A Complete Guide

If an investor asks you what you expect to make in the next fiscal year and you don't have an informed answer, you're dead in the water.
Finding success in the complex and competitive modern business environment requires a forward-looking strategy. Drawing on historical performance, market research, and current trends, data-driven forecasting models can help companies gain a competitive advantage.
There are many different forecasting models to choose from and even more software solutions to help deploy them.
In this guide, I’ll break down some useful forecasting models—and explain how you can use them to gain an edge in your industry.
What is a Forecasting Model?
Forecasting models are tools used to predict future performance based on historical and current data. In the business and finance world, the term forecasting almost always refers to financial forecasting.
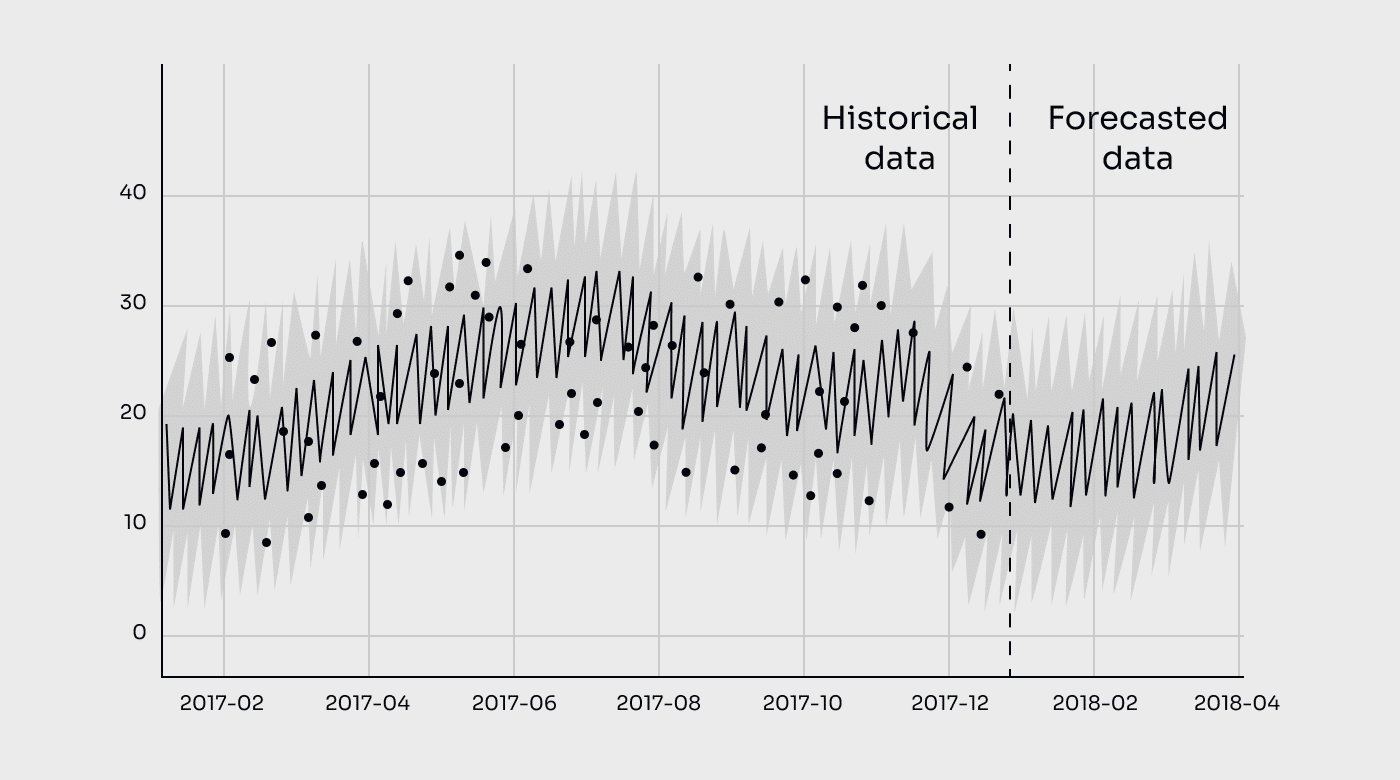
A forecasting model uses a statistical methodology, or formulas and assumptions, to predict future performance, including revenue, customer demand, and churn rates.
More specifically, these models are used to determine how changes in certain variables and parameters are likely to impact performance (unlike budgets, which help you allocate your cash flow). For instance, a restaurant chain might employ a model to determine how changes to a store’s operating hours or seasonal patterns will impact sales revenue.
There are all sorts of forecasting models out there (discussed in depth below) but they all have the same objective: use historical data, assumptions, and current trends to predict future performance.
These tools can be applied to an endless range of potential scenarios and are crucial for finance, marketing, and executive teams. For the rest of this guide, I'll cut out the rest and focus explicitly on financial forecasting models.
Forecasting Methods
Choosing the right type of modeling technique (and the specific forecasting model) is very important. Before you can choose though, you need some baseline information about these models and how they work.
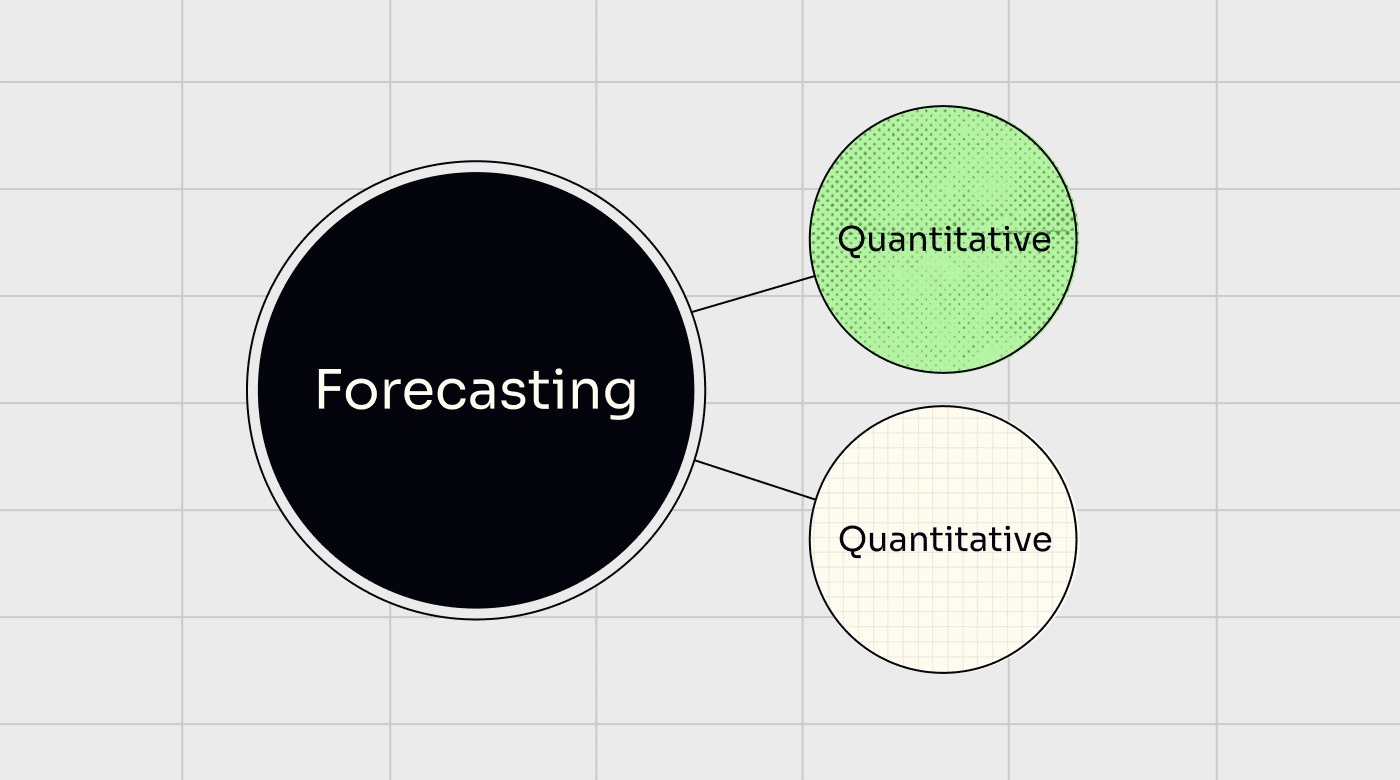
There are two broad categories of forecasting models: quantitative and qualitative.
Qualitative Forecasting Methods
Qualitative forecasting is based on expert opinions and judgment. They are:
- Subjective by nature
- Not based on past data or trends
- Used to analyze non-numerical data
Qualitative methods are used when the focus of the analysis can’t be measured or counted. For example, if a company wants to understand the motivations and beliefs that drive consumer behavior and impact their purchasing decisions, no quantitative data can reveal those things. Qualitative forecasting relies upon individual opinions, research, and studies.
Quantitative Forecasting Methods
Quantitative forecasting uses numerical patterns in historical data to forecast future performance. Quantitative models:
- Are more objective in nature
- Rely on historical data (e.g. sales revenue, headcount, etc.)
- Analyze numerical data
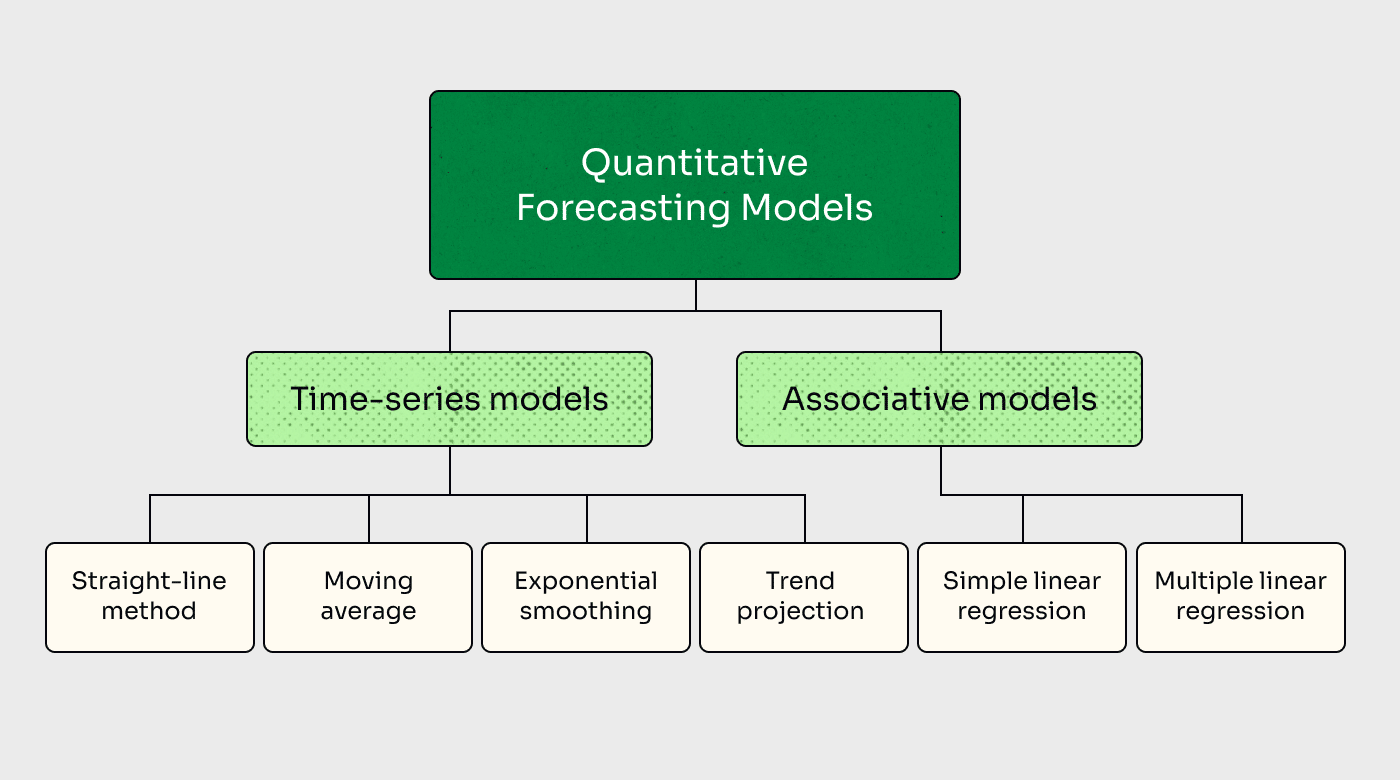
Within the quantitative category, there are two further subcategories:
Time Series
Time series models focus on patterns and their variations, relying on historical data.
For instance, a company preparing to launch operations in a new country could use data from its previous launch (including sales data, workforce trends, etc.) to prepare a budget for the new launch.
Associative/Causal
Associative models, also known as causal models, are more advanced, focusing on multiple lines of highly refined and specific information. They utilize past data and excel at taking seemingly disparate data and relating it back to the forecast’s intended purpose.
They can also be used to create associative relationships between a business' financial metrics and external variables. For instance, an appliance manufacturer might build a model that predicts appliance sales based on the number of new housing permits in a certain area.
Below, I’ll go over the basics of some of the most common forecasting models businesses use today.
Common Quantitative Forecasting Models
Quantitative forecasting models rely on past data to make predictions about the future.
For example, a retailer might look at Q4 sales data from the past three years to predict holiday sales volume in the peak shopping season.
If you don’t have internal data (for instance, if you’re a brand-new retailer), you could still potentially utilize quantitative forecasting—you’d just need to have access to comparable data from your industry.
Within the quantitative forecasting world, there are several popular models to use—I’ll explain them below.
Time Series
Time series models are used when there are several years’ worth of data available. They’re most helpful when relationships between data points (average price point and sales volume, for example) are relatively stable and trends are easily identifiable.
For example, a firm may choose to employ time series models to project the growth of an existing product line.
Say the product line in question launched four years ago and has experienced steady growth ever since. The firm could take that data, then apply a time series model to predict where sales volume might be next year (or several years down the line).
Straight-line
Straight-line modeling is a simple technique that provides estimates of future revenues or other financial metrics by considering past figures and assuming those trends will continue.
For instance, if a company has experienced 3.6% annual sales growth over the past four years and expects current trends to continue, it can utilize a straight-line model to predict the amount of sales revenue the company is likely to generate in the future.
As the name suggests, the straight-line model assumes consistent and predictable change. It’s simple, yet can still be a good starting point to forecast a range of financial metrics and scenarios.
What's the difference between time series and straight-line forecasting?
Time series models are typically employed to understand trend cycles, cyclical fluctuations, and seasonality, whereas straight-line forecasting is typically used to predict stable growth (or decline).
Picture time series forecasts as a self-contained circle or spiral; think of straight-line as a, well, straight line!
Moving Average
The moving average model is somewhat similar to the straight-line model described above, but it works with smaller datasets and focuses on short- to mid-term time ranges.
Firms may use moving average forecasting models to predict holiday demand, for example. The company might then consider the moving-average sales revenue figures from Q4 of 2019, 2020, 2021, and 2022, respectively.
They could apply a simple formula to arrive at the moving average:
(A1 + A2 + A3 + A4) / N
where
A = Average for a specific period
and
N = Total number of periods
The firm could then use this moving average to create a forecast for this year’s expected holiday sales figures.
This formula needs a good dataset to work with; in the example I used above, they’re using four years of data. But crucially, it ignores non-Q4 sales data, which is largely irrelevant when forecasting holiday sales specifically.
Exponential Smoothing
Exponential smoothing models are similar to moving average models, but they apply a weighting methodology to give more weight to recent data.
For instance, consider the same example from above. The company has four years of historical holiday sales data—but they’ve been experiencing consistent growth during that time period.
As such, the data from older years is less relevant than the fresh data from the previous two years.
Exponential smoothing models apply a higher weight to more recent data. This is helpful because it helps companies adapt their forecasts to reflect more recent data trends.
Though it may be tempting to use older data if it shows a rosier picture (2021 valuations vs. 2022 valuations, anyone?), it's imperative that you use the most appropriate data to get a good idea of what's to come.
Trend Projection
Trend projection fits a trend line to a mathematical equation and then uses the equation to project that trendline into the future.
A trend projection model looks at past data—like sales numbers from weekends, weekdays, or specific seasons, for example—to make predictions about future demand during those times.
It can be applied in a similar way as straight-line modeling, depending on the data sets you’re working with. There are several sub-categories within trend projections, including logarithms, polynomials, and the slope-characteristic method.
Associative Models
Associative models, also called causal models, connect a certain business metric (like revenue) to a separate independent variable (like population growth in a city).
Causal models are helpful in connecting future business operation expectations with distinct variables, both inside and outside of the business.
For example, a food truck owner might use a model to predict demand at a summer fair based on the forecasted weather for the weekend. Alternatively, a real estate development firm may use causal modeling to predict future demand for newly built homes in a community, based on projected population growth in the area.
With that said, associative models can also be used to predict a certain variable based on its connection to other, related variables. For instance, a firm could use causal modeling to forecast the estimated profit margin that would result from increased advertising spend.
By definition, associative models are more complex than time series models.
Associative models can be used to bring in external data and attempt to establish a relationship between a relatively standard business metric (e.g., revenue) with a metric that many firms may not even consider (e.g., a city’s typical annual household income).
Though they’re more complex, causal models can be extremely useful for building more accurate forecasts—and staying ahead of competitors.
Simple Linear Regression
Simple linear regression helps companies examine how a dependent variable (like sales revenue) correlates to an independent variable (like money spent on advertising).
Or, using the external data example, simple linear regression could also be used to determine how a dependent variable (like sales revenue per location) correlates to an independent variable (like household income in a given county).
Simple linear regression can be visualized by plotting a line graph with one metric on the Y-axis and another on the X-axis. But as the name suggests, you have to keep it simple; these models can only support comparisons between two variables.
Multiple Linear Regression
As you may have guessed, multiple linear regression builds on simple linear regression by adding multiple business variables to the equation.
There’s still a single dependent variable (e.g., sales revenue), but there can be multiple independent variables that could be from data sources that are internal, external, or both.
Multiple linear regression is complex and typically requires statistical analysis software to complete. Also, the data used (number of elements of data, length of time analyzed, decisions made in the data clean-up phase) is important to the accuracy of the resulting regression formula.
Using linear regression forecasting requires you to take a critical look at the results to consider variables not captured by the data used in the regression and whether these missing variables will cause the model to over or underestimate the impact of an independent variable.

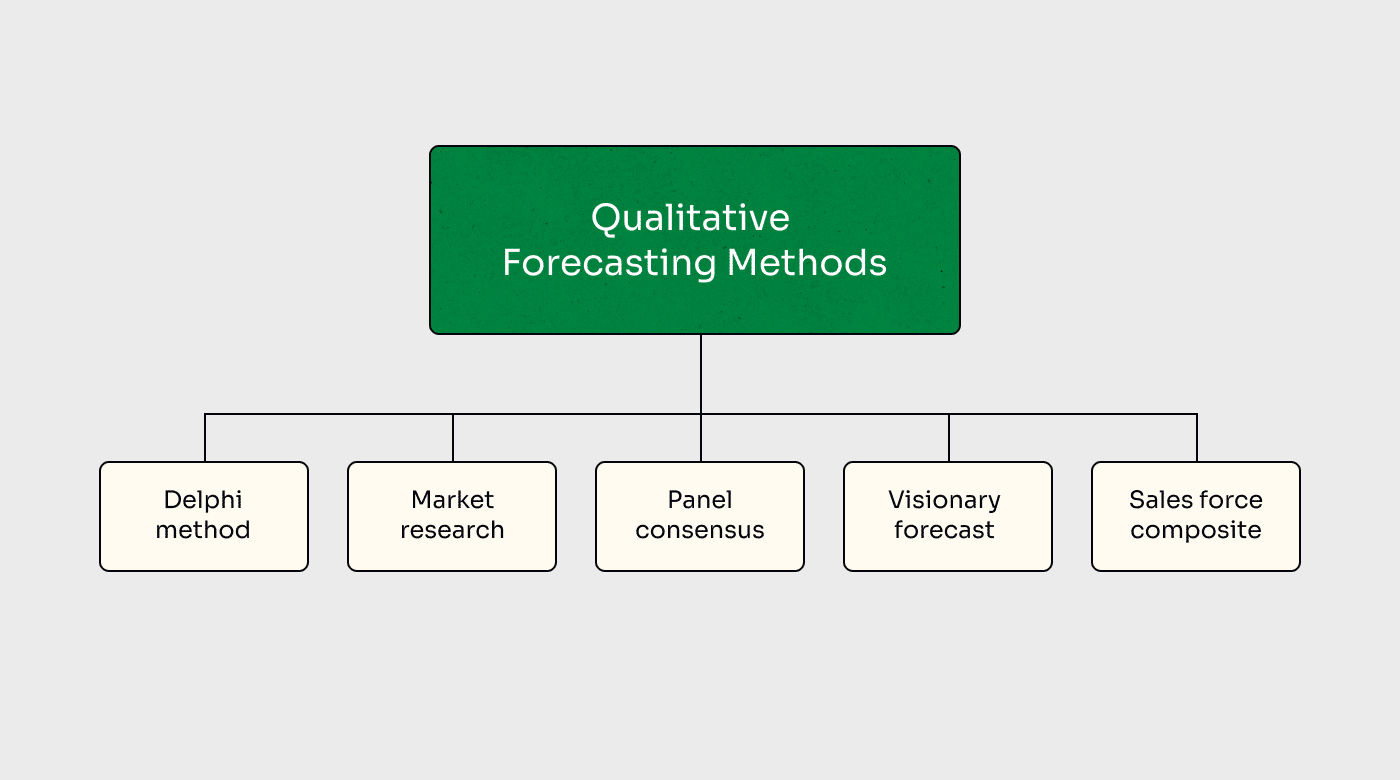
Common Qualitative Forecasting Models
Qualitative forecasting models utilize subjective, qualitative data. They’re often used in situations when quantitative data is not available.
For instance, a qualitative model might depend on input from an expert or the results of a survey of potential customers.
Qualitative forecasting is more subjective in nature, but it’s still quite useful—particularly for situations where there are no solid data to pull from. PS: I still find it weird that "data" is the plural.
Anyway.
All qualitative forecasting models will require some sort of data collection (expert interviews, panels, surveys, etc.), but they differ in how that data is collected and then used to inform forecasts. These are typically less helpful for financial forecasting, as you're essentially throwing spaghetti at the wall with all of them; some are just more accurate than others.
Delphi Method
Ever heard of the Oracle of Delphi? Her whole job was making predictions about the future - not overly dissimilar from a CFO... right?
Yes, you're allowed to start referring to yourself as the Oracle of your business. No, you can't say I gave you permission.
The Delphi method draws on expert opinions, typically using a small group of topical experts. For instance, a private education firm may consult with a group of professors to gather data about student habits.
In the Delphi method, experts are interviewed to collect data. Crucially, each expert is interviewed independently, and then data is aggregated after the fact. This helps to prevent group bias and allows for full freedom of expression.
The Delphi method uses “rounds” of data collection. The first round is individual, but the later rounds are communal. Each expert's answers are shared with the broader group, opening it up for discussion. Experts are free to change their opinions or estimates in later rounds.
Because the Delphi method usually uses small groups of experts, it’s important to select the right people to interview, as the data is only as good as the experts’ know-how.
Market Research
Bet you've never heard of this one before-- hey, I see you rolling your eyes!
Market research is a very common forecasting method used by firms to gather the opinions of potential customers. For instance, a food manufacturer launching a new low-calorie ice cream brand might ask customers about their weight-loss goals and dietary choices via online survey.
Market research is usually a numbers game, so the more responses you can glean from the public, the better.
Market research can be conducted via phone, email, text, in-person interviews, and more. It’s often done with the help of market research firms, which handle the interviewing and data collection.
Panel Consensus
Panel consensus utilizes a focus group setting that draws on expert and employee opinions. It’s often conducted using a panel of employees from all levels of the company rather than executives alone.
Uniquely, this methodology combines—and gives equal weight to—the opinions of true experts and “semi-experts” alike. For instance, a team attempting to project seasonal demand for a certain flavored drink may include staff from sales, marketing, or even the retail floor.
As the name suggests, the panel must come to a consensus estimate. The group can share opinions and debate, but must ultimately reach a consensus.
Visionary Forecast
Visionary forecasting relies on the insights and opinions of a single individual - I found it interesting that this wasn't called the Delphi method, considering she's just one person... but then again, she had the help of the gods (and no one asked me).
The visionary in question could be you, another member of your executive team, an outside consultant, or an industry expert.
Since this forecasting model relies on a single visionary, it’s prone to confirmation bias, and best used in conjunction with other methods.
Sales Force Composite
Sales force composite forecasting focuses on gathering qualitative data from sales staff. It typically draws on the opinions of multiple team members; ideally, those who are involved with the type of sales related to the product in question.
For instance, if a vehicle manufacturer was contemplating a new model, they might conduct a survey among their sales staff to gather information about customer opinion, needs, common questions, budgets, etc.
The idea here is that sales representatives have hands-on experience interacting with customers (and know what really drives sales) and therefore, have more valuable insights into customers' real-world behavior and desires.
Sales force composite modeling can also be useful in identifying regional and localized trends.
While the list above isn’t comprehensive, it covers many of the most commonly used forecasting models. With that said, some are certainly more popular than others.
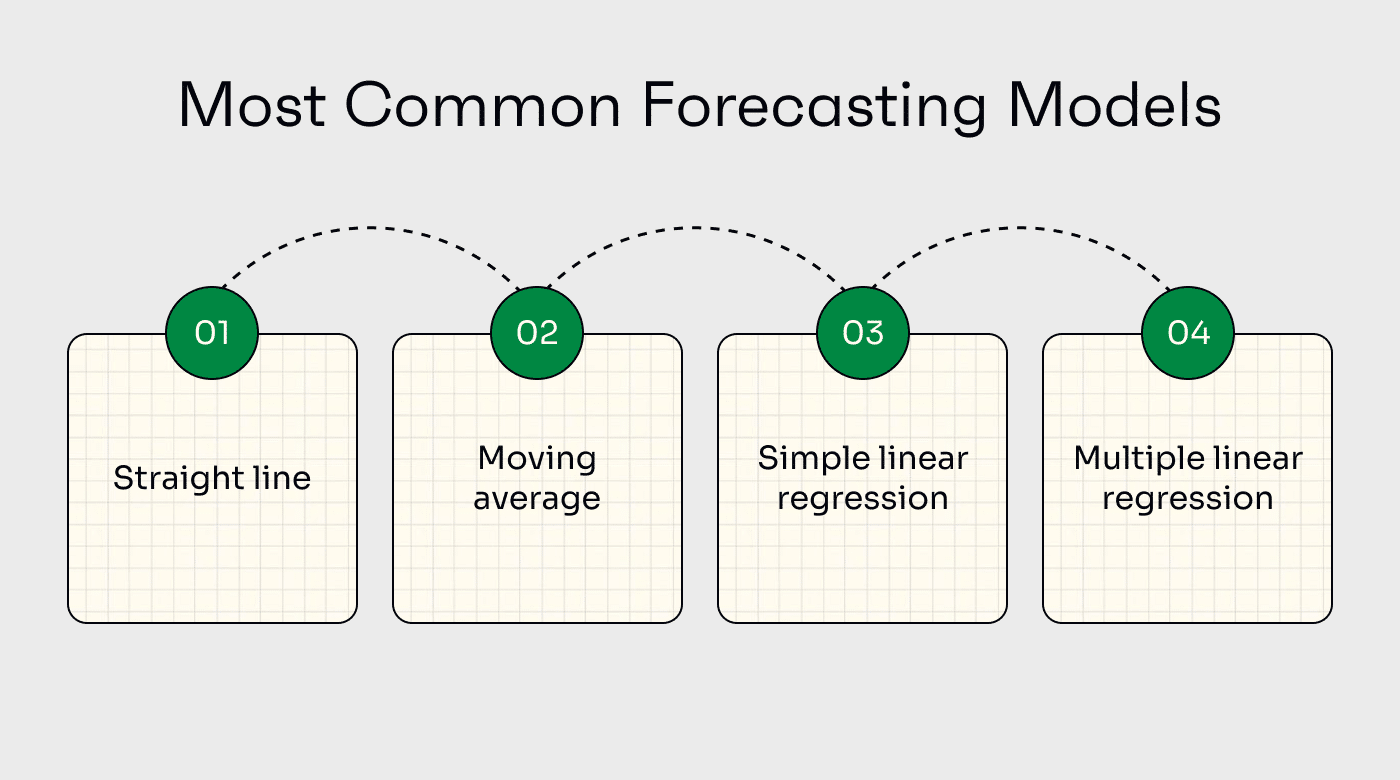
What are the Most Common Forecasting Models?
Overall, time series modeling (namely straight-line and moving average models) tends to be used most often.
This is partly because time series models allow for more objective forecasting based on historical data. They do not rely on expert opinion or customer feedback, which can be fickle and prone to biases. Instead, they use hard data to construct reliable models for future performance metrics.
These models are also popular because they’re relatively simple to use and often don’t require any specialized software. Some software that you might already be using, like your enterprise resource planning system, likely has these statistical modeling features built-in. Straight-line modeling could even be done by hand in Excel with relative ease.
Associative (causal) modeling is also commonly used, but it’s a bit more complicated and often requires software or some level of training. It’s particularly useful when trying to track relationships between very distinct variables, whether just one independent variable (simple linear regression) or multiple (multiple linear regression).
As far as qualitative forecasting models go, market research tends to be the most common. Many companies conduct surveys and gather feedback from customers and use this data to inform strategic decisions moving forward. Others choose to contract outside market research firms to conduct more comprehensive customer research surveys.
Why is Forecasting Important?
As I alluded to at the very beginning of this article, forecasting is the key to preventing you from:
- Losing investors, then
- Getting fired
Just kidding. Kinda.
Forecasting is important because it allows firms to plan for the future. The entire idea behind forecasting is to gather information from various sources, then use that information to make better decisions.
For example, a business that supplies retailers with specialty goods might use a forecasting model to predict demand for the busy holiday shopping season. Their modeling efforts could better inform demand estimates, which could allow them to ramp up and build up inventory levels to meet seasonal demand.
Or, a company might choose to use a forecasting model to analyze the financial impact of different price points or sales strategies being considered for an upcoming product launch. They could pair these efforts with seasonal demand forecasts to find not only the best sales strategy but also the ideal time to launch seasonal sales and promotions.
Ultimately, whatever the metric being examined, the idea behind forecasting is to gain a glimpse into future trends or financial metrics to prepare for what’s ahead.
How to Use Forecasting Models
Each forecasting model is deployed in a different way. But the general strategy is as follows:
- Be clear on your purpose. Is determining when you need to raise your next round of financing the goal? Then focus on forecasting cash flow and make conservative assumptions.
- Select the proper model to use. I discussed specific use cases for the financial forecasting models listed above. Ultimately, many firms will choose to use multiple models—but it’s helpful to narrow it down to one or two to start with.
- Gather data. Quantitative models will use historical data (usually company financials), while qualitative models use subjective data gathered from customers or experts in the industry.
- Construct the model. This process varies significantly depending on the specific model being deployed. Many models can be set up in Excel or similarly ubiquitous tools. Others may require specialized statistical or forecasting software.
- Determine your level of confidence. Confidence intervals are used to express the level of uncertainty associated with a forecast. The most commonly used confidence intervals are 90%, 95%, and 99%. The higher the confidence level, the more reliable the forecast. As you'd expect, the more objective the data, the higher the confidence level tends to be.
- Deploy the model. Next, deploy the model using the recommended protocol for that particular model, and draw on the most relevant data you can compile.
- Analyze results. Take the results you find and compare them to other estimates or forecasts you might already have. You may also wish to run other models using the same data to detect differences.
Some forecasting models require expert-level training in statistics or financial forecasting, while others are much simpler to run. Ultimately, the complexities and challenges of forecasting depend on the model chosen and the quantity & quality of data you’re working with.
What Software is Used for Forecasting?
Many different types of software can be used for forecasting, from basic spreadsheets to machine learning and AI-powered tools.

While many financial models can be run in Microsoft Excel or Google Sheets, many require ERP software, EPM software, or some other specialized software.
Before you go and buy any new software, be sure to check the feature set of your existing tools. Some inventory management software comes with demand forecasting features and other tools to help plan inventory levels. And your payroll service might offer workforce forecasting features.
For qualitative forecasting, there aren’t too many software options worth considering, as most firms rely on third-party research firms and consultants that specialize in conducting and publishing market research.
Ultimately, because “forecasting” is such a broad term, there are many different software solutions that can be utilized, but forecasting software offers specific benefits for your business.
Forecasting Models Can Give Your Business an Edge
Knowing when, where, and how to utilize financial forecasting can give companies an edge.
With proper forecasting models and accurate data inputs, companies can prepare more accurate budgets, fine-tune their goals and competitive strategies, and be more prepared for the future.
Looking to sharpen your skills as a CFO or related financial position? The CFO Club is a community of like-minded SaaS and tech financial leaders looking to excel in their respective fields. Subscribe to The CFO Club newsletter for industry insights and more content like this.
