Financial Forecasting 101: Peek Into Your Company’s Future

Financial forecasting is like getting your financial fortune told by a palm reader… but way more reliable.
You feed a couple of reasonable assumptions into a forecasting tool, and it can tell you what your income statement, balance sheet, and other financial statements will look like at a specific date in the future.
Your actual financial statements will rarely look like your forecasted financial statements but that’s okay—the idea is to get as close as possible.
In this guide, I’ll help you understand the models, methods, and processes you can use to forecast your company’s financials.
What Is Financial Forecasting?
Financial forecasting refers to the practice of estimating the company’s financial position based on metrics like revenue growth, churn rate, and profit margins.
CFOs and finance teams rely on forecasts to make financial decisions about budgeting, business planning, resource allocation, and overall business strategy.
Estimates used in a financial forecast are created using historical data and an assessment of the company’s future economic prospects. For example, it’s reasonable to estimate positive revenue growth for the future if your company’s growth has accelerated over the past two years and there’s a high demand for your SaaS.
You could go ahead and estimate the figures for each line item on the income statement, balance sheet, and cash flow statement but, generally speaking, the amount of time you spend on each item depends on the purpose of the forecast.
You might make broad assumptions about all line items if you’re forecasting to get a general overview of your financial position but if you’re forecasting financials ahead of a merger or acquisition, it’s important to be thorough with your assumptions for everything you’re looking at.
Financial Forecasting Models
A forecasting model refers to a systematic framework used to predict financial outcomes based on historical data, assumptions, and various mathematical and statistical techniques.

Forecasting models are broadly categorized as qualitative and quantitative.
Qualitative Forecasting Models
Qualitative forecasting methods are based on expert opinions and judgment. The two most popular qualitative forecasting methods are:
- The Delphi method: The Delphi method involves collaborating with industry experts who can analyze the market and predict your company’s financial performance. Unless you have an incredibly qualified expert in your network, I recommend using market research or, better yet, a quantitative approach instead.
- Market research: Market research helps you forecast financials based on competition, consumer trends, and economic conditions.
Quantitative Forecasting Models
Analysts typically use quantitative forecasts because they’re more objective. Quantitative methods can be further categorized into time series and associative methods. Here are examples of both:
- Time-series:
- Straight line: The straight-line method is used when you think past trends will continue. For example, if your revenue has grown 5% per annum over the past three years and you believe revenue will grow at 5% the next year, use the straight-line method.
- Moving average: The moving average method uses the moving average of the previous periods to forecast financials over the short- or medium-term.
- Exponential smoothing: Exponential smoothing is similar to the moving average model, except that recent periods get more weight when calculating the average. For example, if revenue growth was 5% in 2022 and 8% in 2023, you could assign a weight of 0.6 to 8% and 0.4 to 5% to calculate the average, which would be 2.6%.
- Trend projection: Trend projection involves using historical data and statistical methods to find and extrapolate trends to predict future values. Analysts typically use methods like least square, Box-Jenkins, and judgmental forecasting for trend projection.
- Associative:
- Simple linear regression: Simple regression analysis helps examine the relationship between a dependent variable (like sales) and an independent variable (like ad spend). The relationship (expressed as a number) is used to forecast future values.
- Multiple linear regression: Multiple regression analysis helps examine the relationship between one dependent variable and multiple independent variables. For example, we could add customer retention as another dependent variable to the simple linear regression example. Just like simple linear regression, the relationship is expressed as a number and used to forecast future values.
How To Perform Financial Forecasting
There are a few more things to address before you jump into your Excel spreadsheet and forecast your company’s financial statements. Here’s a step-by-step process to perform financial forecasting:
Determine the Purpose
Moving with intent allows you to focus on things that matter. Are you forecasting your financial statements to see if you have enough cash? Or is it because you’re planning an exit and want to value the business?
Compile Historical Data
If you’ve been in business for a few years, almost all of the data you need—like revenue, earnings, and growth—is available in your financial statements.
Three to five years of historical data is ideal but you may need to use a greater number of years’ historical data depending on factors like:
- Forecasting horizon: You’ll need more historical data to capture trends if you’re forecasting two or three years out. On the other hand, shorter-term forecasts require more recent data.
- Data relevance: Older data from periods where there were significant changes in your product, business model, or market conditions isn’t as relevant as recent data that more accurately reflects your current business.
- Stability and consistency in data: Use a longer historical period if your business performance or market conditions have had significant fluctuations.
- Market dynamics: Is the industry subject to rapid changes? If it is, focus more on recent data.
If you’re a startup and don’t have any historical data, consider using a qualitative model of forecasting or industry benchmarks from SaaS Capital and similar sources.
Define a Time Frame
How far into the future do you want to forecast your financial statements? One year is quite a common choice, but you may choose a different time frame based on your specific needs.
For example, if you’re going to raise capital in six months, forecast your financial statements for the next two quarters. You might also choose to forecast financial statements for a one-year time frame to understand how raising new capital will change your capital structure and otherwise impact your business.
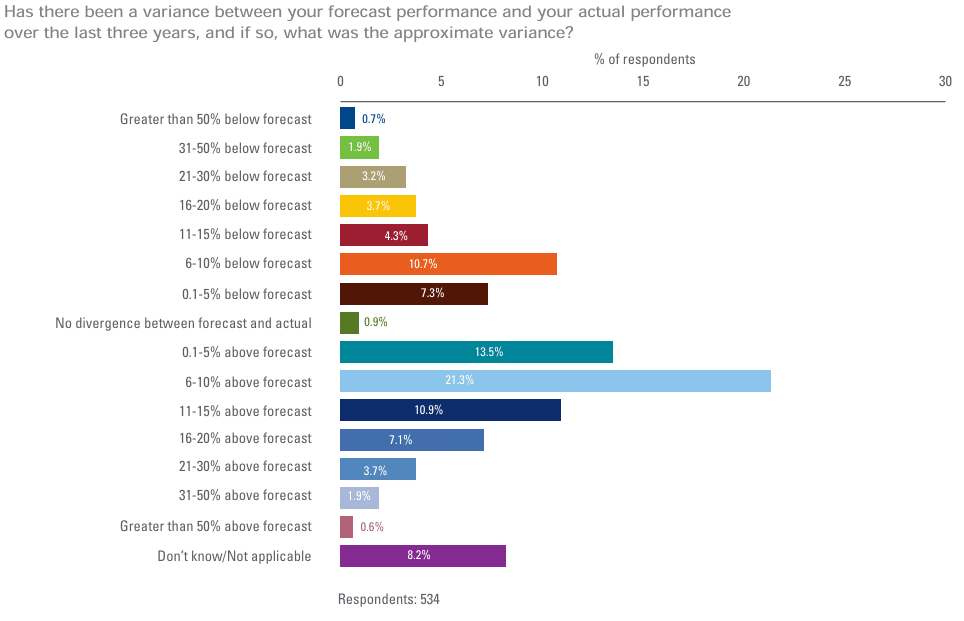
One thing to note when deciding on the time frame is that accuracy reduces as you increase the time frame because there’s more time for independent variables like the economy to change. This may seem obvious but it’s often overlooked.
The variance in forecast and actual results can be significant according to a KPMG report:
Pick a Forecasting Method
No one method will reign supreme; choose a financial forecasting method that fulfills the purpose of your forecasting.
The straight-line method is a less resource-intensive method if you just want a general idea of future revenue and profit, based on expected subscriptions and renewals next year.
On the other hand, linear regression might be a better choice if you’re planning a major shift in your operational cost structure to become profitable over the next year.
Once you’ve landed on the best forecasting method for your use case, build pro forma financial statements using that method. Use these statements as a basis for financial planning and strategic decision-making.
Analyze the Forecast
Look at the numbers and see if they tell a story you like. If they do, that’s a great starting point. If not, find out why.
Try to spot potential villains in the story—things like not having enough cash for growth—using what-if scenarios.
Play around a bit, stress-testing numbers to understand the impact of independent variables like the economy on important figures.
Let’s look at a likely scenario.
Suppose the original purpose of forecasting was to see if the company could experience a cash crunch over the next quarter. The forecast shows you’ll remain cash-positive throughout the quarter, but your cash balance will reduce from current levels.
That’s a problem… but not panic-worthy.
Using this info, you jump into the forecasted cash flow statement to see where cash is leaking.
- If you’re losing cash in operating activities, that would be a serious issue, as it signals your operations aren’t generating enough cash.
- On the other hand, the cash balance could also be reduced because you plan to invest in a new asset or pay off debt. That’s a much easier problem to solve because capital expenditures and debt repayments aren’t recurring activities.
The usefulness of your forecast - even if everything in there is accurate - is still reliant on you using the data appropriately.
Monitor Actual Numbers
Once you have the forecast, keep track of your actual financial statements and compare them with the forecast.
Are the actual numbers moving toward the forecast as expected?
If not, you should investigate the differences through variance analysis so you can prepare for potential issues before it's too late.
Financial Forecasting Example
Let’s walk through a simplified example of how financial forecasting works.
Suppose you want to project your income statement for the next quarter. You expect a significant uptick in demand as a result of a new high-performing marketing campaign.
You expect revenue to grow by 20% and you want to forecast the income statement to see if the business will turn profitable by the end of that quarter.
Here’s the data from the income statement for the accounting period ending Q3 2023:
| Revenue | $50,000 |
| Cost of sales | $10,000 |
| Gross profit | $40,000 |
| Operating expenses | $25,000 |
| Operating income | $15,000 |
| Non-operating expenses | $20,000 |
| Net income | $(5,000) |
Here’s what the financial model might look like, assuming a 20% revenue growth rate and assuming the operating and non-operating expenses will remain unchanged:
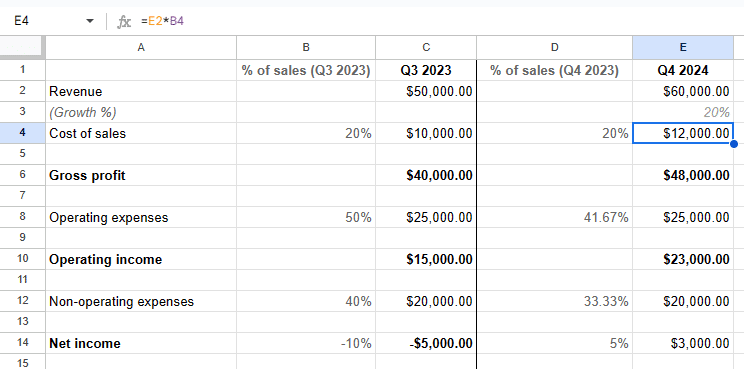
With the rise in demand, the business could turn profitable over the next quarter.
I’ll reiterate that this is a simplified example to illustrate how you can forecast a financial statement. I’ve assumed operating and non-operating expenses remain unchanged, which is rarely the case in reality.
If you feel ready to start forecasting your financial statements, why not try building a three-statement model?
The Role Of Forecasting Software
I’d be remiss if I didn’t mention how much easier this can all be with good technology.
Forecasting software makes the process quick and easy, with top solutions integrating into accounting software to automatically pull historical data for the number of years you select. Another benefit of forecasting software is that they also offer built-in features like sales analytics and demand forecasting to help you make data-driven assumptions about the future.
Forecasting software has been around for a while. What’s coming is even more exciting—AI-first FP&A tools are about to revolutionize how FP&A teams forecast financial data.
AI models can use historical data to come up with assumptions about the future and generate forecasts within seconds. While these forecasts still require a CFO’s insights, they make the process significantly faster, saving the finance team valuable time.
“AI models will automatically seed or generate forecasts based on historical and trending data, providing a starting point from which finance teams can augment the plans with their context and judgment about business and economic conditions. Finance pros then aren’t creating forecasts from scratch; they’re refining and vetting them, drastically shortening the forecast process.”
Ready To Get Your Fortune Read?
Financial forecasting can feel tricky the first time. Making reasonable assumptions about the future requires skill, experience, and foresight—things that come with time.
But the other, more mechanical part of forecasting—building a model—is easy to automate using software. I recommend letting the software take care of building a model so you can focus on the strategic aspects of financial forecasting.
And remember, your financial forecast isn’t set in stone.
Once you have the forecast, change your assumptions to assess your financial situation under different scenarios. Use these insights to minimize risks and fortify your financial position.
In contrast, if you're interested in analyzing the success of your past data, financial analytics software would be a better fit for that purpose.
Ready to compound your abilities as a finance leader? Subscribe to our newsletter for expert advice, guides, and recommendations from the finance leaders shaping the tech industry.
