How to Build a 3-Statement Model: A Complete Guide

Think of a financial model as a crystal ball, enabling CFOs and analysts to peek into the company’s future financial position; the three-statement model is one of these mystical financial models.
It’s called the three-statement model because it involves forecasting three financial statements: the income statement, the balance sheet, and the cash flow statement.
In this guide, I’ll walk you through the steps required to build a three-statement model.
Understanding the 3-Statement Model
The three-statement model involves projecting the three financial statements based on historical financial statements and assumptions about the future.
Before you build your first model, it’s important to understand that the three financial statements are interlinked in multiple ways. Changing a figure on the income statement can impact the balance sheet as well as the cash flow statement.
For example, decreasing the office rent expense from $2,000 to $1,500 on the income statement has the following impact:
- Increases net profit in the income statement
- Increases the cash balance and shareholder’s equity (because of increased profit) in the balance sheet
- Reduces the cash outflow on the cash flow statement
Be mindful of these linkages so you can use accurate formulas in your model.
The 3 Core Elements
Let’s take a closer look at each of the three elements in the three-statement model to understand the ways in which they’re connected.
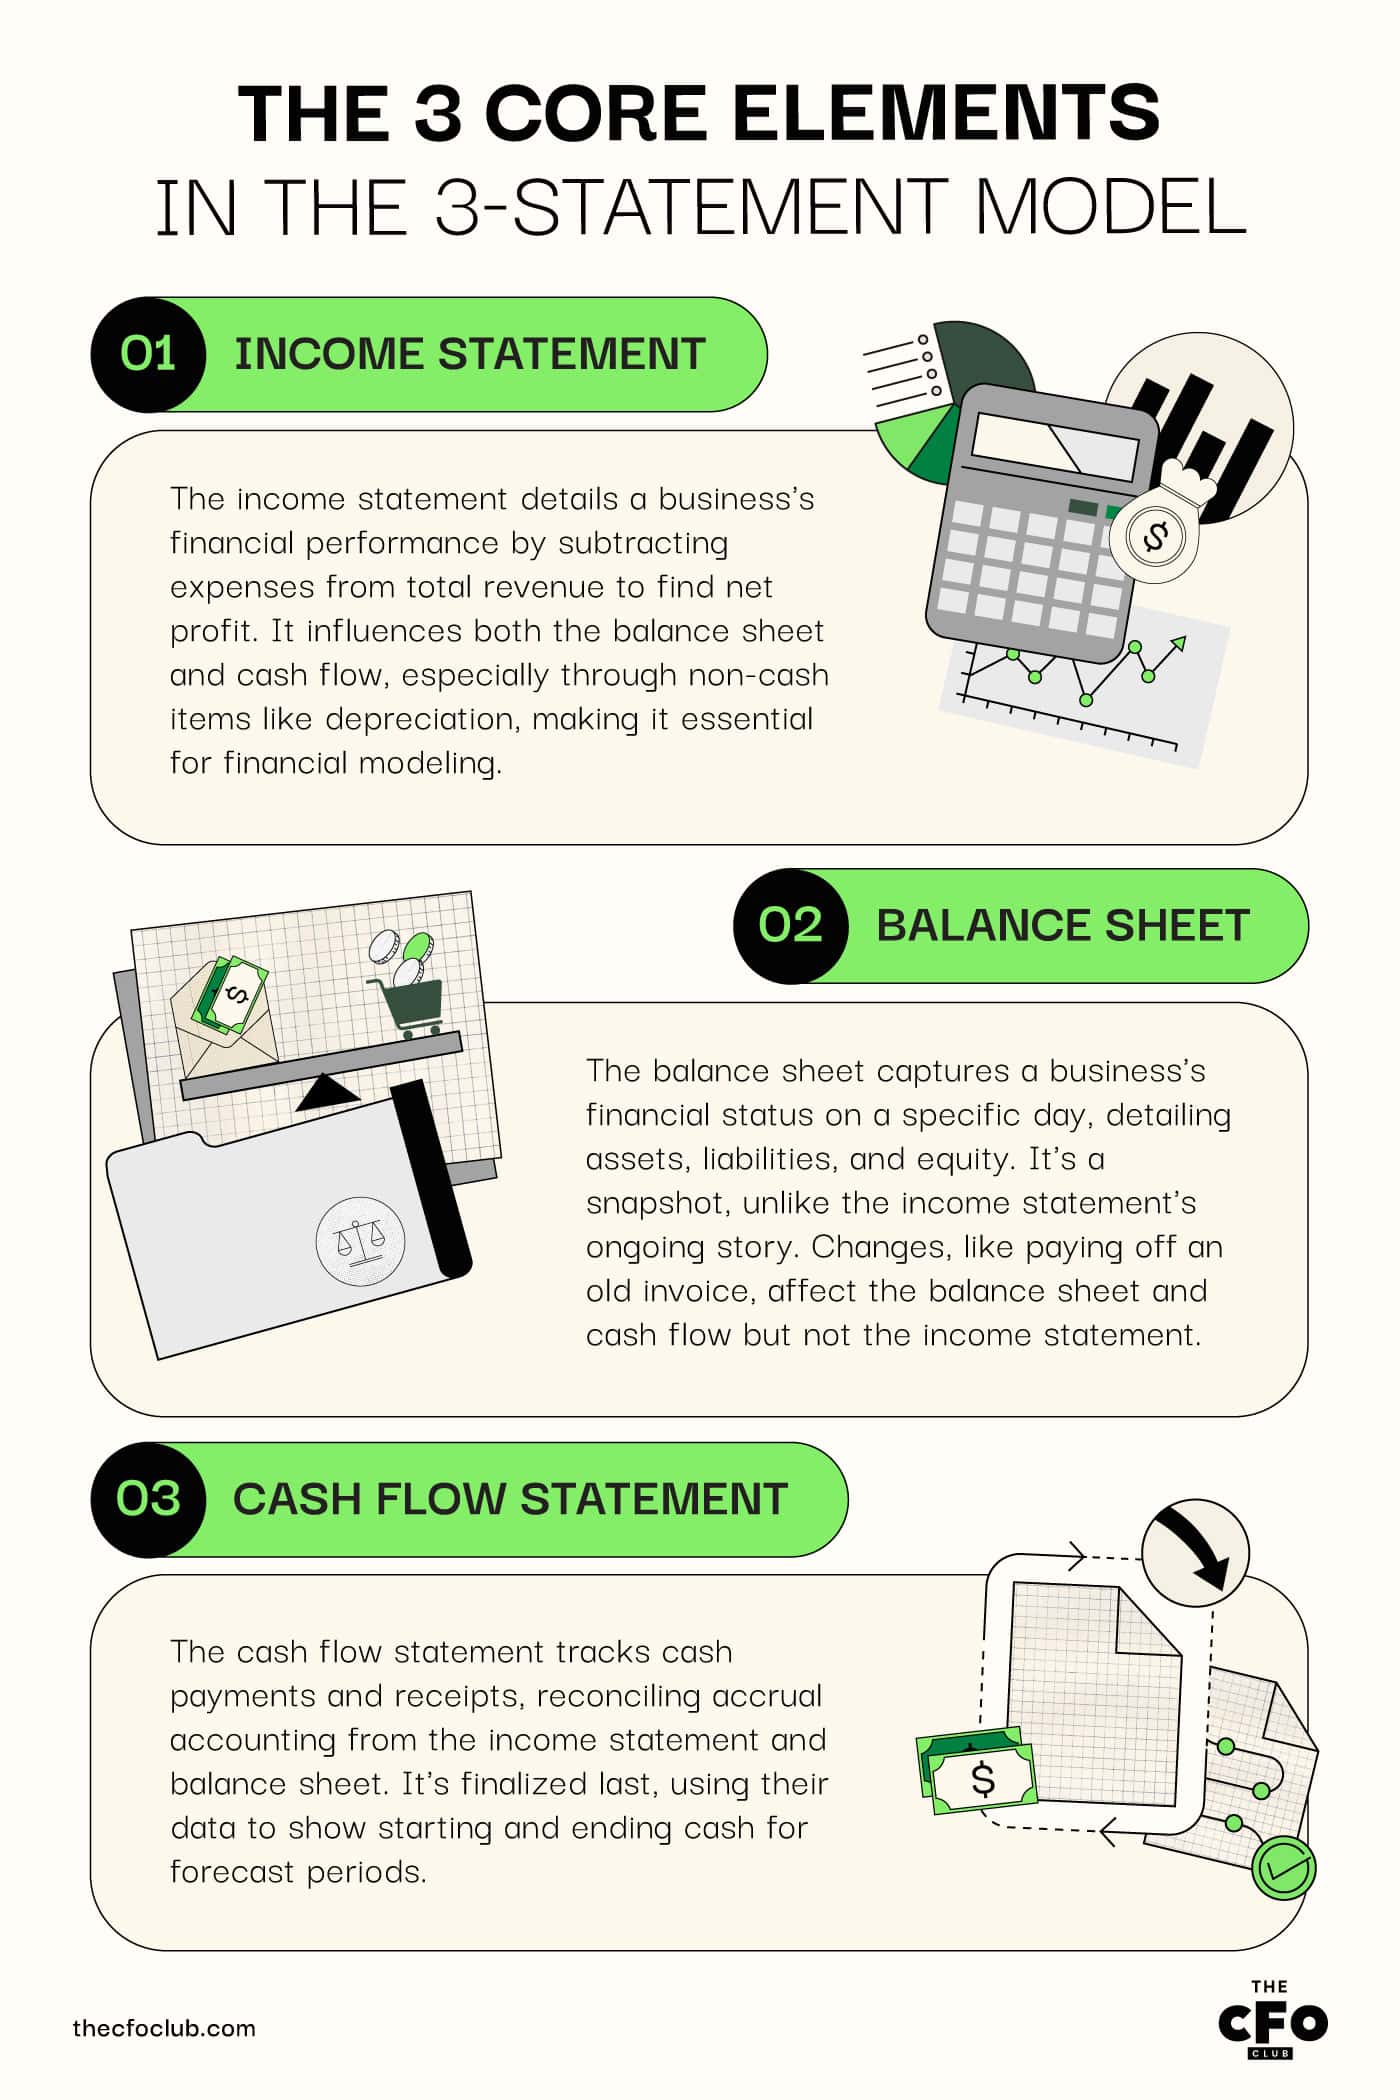
1. Income Statement
The income statement, often called the profit and loss statement, is your business’ performance report for a specific period.
To create the income statement, you sum up the revenue and other incomes and reduce the sum by the amount of expenses to get a net profit.
Each line item on the income statement impacts the balance sheet or cash flow in some way, which is why the income statement is the first statement you should model.
For example, the depreciation expense impacts the asset's value on the balance sheet. It also impacts cash flow statements that follow the indirect method (since depreciation is a non-cash expense).
2. Balance Sheet
A balance sheet is your business’s financial summary on a specific day.
Whereas the income statement is a movie that tells a story, the balance sheet is a photograph, showing the position of the company at a specific point in time.
The balance sheet tells you the amount of assets, liabilities, and equity your business has.
Not all changes on the balance sheet impact the income statement or cash flow. But many do.
For example, when you pay an old creditor for an invoice raised a few years ago, the payment will reduce your accounts payable on the balance sheet and appear as a cash outflow on the cash flow statement. It won’t, however, impact the income statement.
3. Cash Flow Statement
The cash flow statement records the payment and receipt of cash.
Since the income statement and balance sheet are created following accrual accounting, the cash flow statement helps reconcile the difference between expenses incurred, income realized, and cash paid and received.
The cash flow statement is the last statement you complete since it requires multiple inputs from the income statement and balance sheet.
Once you add these details, you’ll have the beginning and ending cash balances for all forecast periods.
Constructing a 3-Statement Model
Constructing a model from scratch can be overwhelming the first time.
If you’ve never built a model before, consider downloading a three-statement model template. Just add the numbers to the model, and it will take care of the rest.
Read on to learn how you can build your own models once you’ve had a chance to play around with an Excel template.
Main Things to Consider
Before you create an Excel worksheet and start modeling, here’s what you should keep in mind:
- Assumptions: You’ll have to make various assumptions when building your model. Assumptions drive your model, so make sure they’re reasonable based on historical data and future expectations.
- Modeling errors: If it’s your first time building a financial model, you’ll likely run into errors on your Excel sheet. You can always learn as you go. If you want to feel more confident, you can always take a modeling course.
- Bias: If you’ve spent some time understanding behavioral finance, you know how bias can impact financial models and decisions. Make sure your assumptions are objective for more accurate forecasts.
Incorporate Historical Data
You need historical data to start building your model.
Finding historical data for your own company is easier. But if you want to run a competitor’s numbers through the model, you’ll need their 10K (available on the SEC’s EDGAR database or through access to Capital IQ, provided the company is public).
Finding data for private companies is a lot harder, as this is not public information.
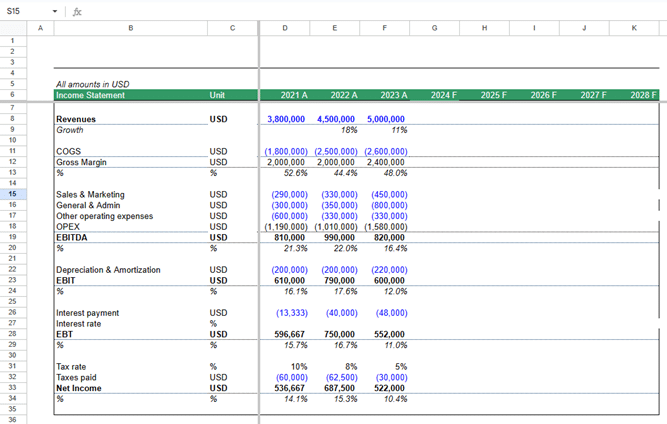
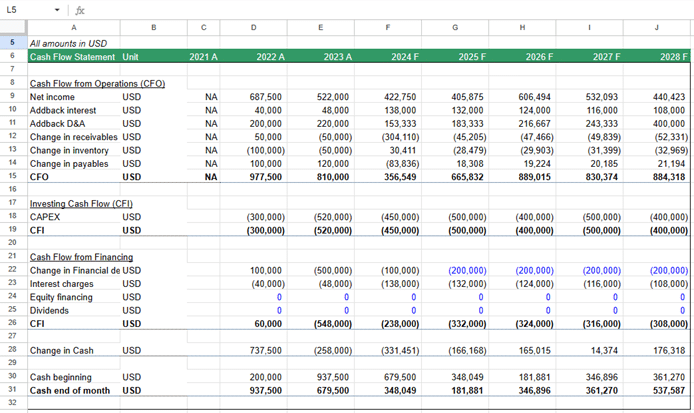
Once you find the data, paste it into Excel. You’ll need to format the data and organize the income statement, balance sheet, and cash flow.
Here’s an example of what your sheet might look like once you add and organize the financial data:
Lay Out Assumptions to Guide the Model
The assumptions are your model’s drivers. Here are some key assumptions you’ll need to make:
Growth
By what percentage do you expect revenue and expenses to grow?
Information about the economy, your financial performance over the past few quarters, and the competitive landscape are examples of factors that can help estimate revenue growth.
Working Capital
Days receivables, days inventory, and days payables are important assumptions.
Days receivables and days inventory typically aren’t relevant for SaaS companies since they don’t have inventory, and in most cases, accounts receivable only result from failed credit card payments.
However, days payables might be relevant if you get a credit period from your contractors and vendors.
Expenses
These include all types of expenses, including sales, marketing, and operating expenses. You can input these manually, use forecasting software, or use a percentage at which you expect them to grow.
Capital Expenditure and Depreciation
Capital Expenditure (CapEx), also called Property, Plant, and Equipment (PP&E), is the cost of fixed assets that provide value for a long time.
If you expect to buy a new office, renovate the data center, or upgrade your infrastructure, you’ll need to add this cash outflow to the cash flow statement.
You’ll also need to factor the effect of depreciation expense into the income statement.
Financing
Do you plan to finance growth via equity or debt? If it’s debt, are you looking at short- or long-term debt?
These decisions will impact multiple parts of the model, including interest expense and cash position.
If your existing investors require you to maintain a specific debt-to-equity or interest coverage ratio, you might want to ensure compliance using a three-statement model before looking to raise more debt capital.
Forecasting the Income Statement
Start with the topline figure. Project the revenue four to five periods out, as per your preference, using the assumed growth rate.
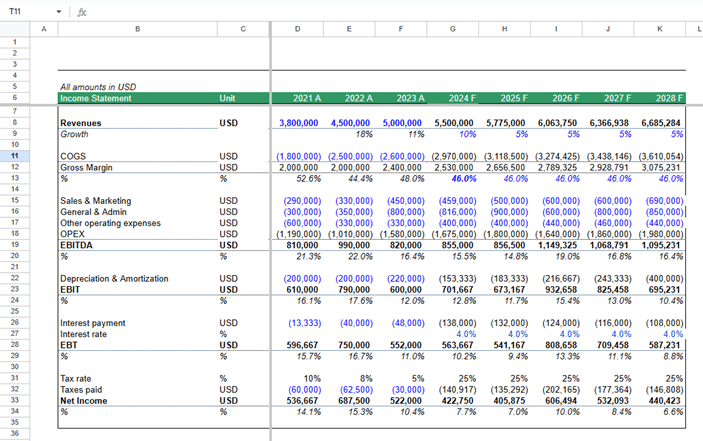
Do the same for all the other line items, except depreciation, amortization, and interest expense, because:
- Interest depends on the total debt. Debt depends on your cash needs. The amount of cash you need depends on your revenue and expenses.
- Depreciation and amortization change based on capital expenditures, the sale of capital assets, and changes in intangible assets.
To calculate these figures, you need to create a capital assets and debt schedule.
Forecasting Capital Assets and Debt
Capital assets and debt schedules help calculate interest, depreciation, and amortization expenses.
Start with the capital assets schedule. Take the current capital assets balance and add expected capital expenditures.
Then, calculate the depreciation and subtract that amount from the capital assets balance to arrive at the year-end capital assets balance that will go on your balance sheet.
Next, create a debt schedule. Start with the existing debt. Add the additional debt capital you expect to raise during a specific period based on capital expenditure and the expected cash balance during that period.
Calculate the interest expense on this debt.
Finish Your Statements
At this point, you have all the data needed to finish your three-statement model. Here’s how to finish all three statements:
Finish the Income Statement
Add the depreciation and interest expense calculated in the capital assets and debt schedules to the income statement.
Calculate the pretax income. Calculate the tax and net income.
If your company has equity shares, calculate the earnings per share (EPS) by dividing the bottom line figure by the number of outstanding equity shares.
Subtract the dividend, if any, from the net income to calculate the retained earnings.
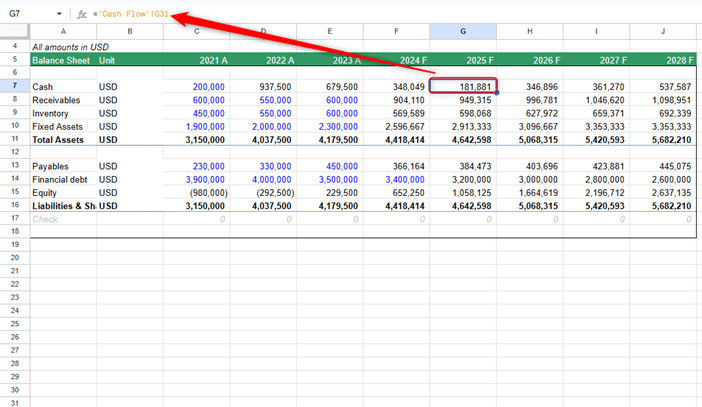
Finish the Balance Sheet
Insert the capital assets and debt figures from the schedule you just created into the balance sheet.
Calculate working capital balances based on the assumptions you made in the second step.
Add the retained earnings for all periods to the shareholder’s equity in each period to calculate total equity.
Leave the cash balance blank for now. You’ll need to pull that information from the cash flow statement.
Finish the Statement of Cash Flows
Cash flow statements have three sections: cash from operations, cash from investing activities, and cash from financing activities.
All the information needed for all sections is available in the income statement and balance sheet you just created. Just follow the steps you would when creating any cash flow statement.
Once you have the closing cash balances for each year, link to them in the balance sheet to complete your model.
Layout and Structure
Three-statement financial models can be structured in two ways.
The first approach involves putting all three statements on a single sheet. This reduces errors when linking to cells in formulas. Alternatively, you can put all three statements on different sheets if you prefer.
There are no hard rules about which one you should use. Both are acceptable. Pick one you’re more comfortable with.
Avoiding the Circular Trap
Once your model is fully linked, you might notice something weird happening—Excel starts freaking out. You’re watching numbers spin, errors flash, and your crystal ball (aka the 3-statement model) suddenly turns into a glitchy mess.
You’ve just met circularity.
Circular references happen when one cell in Excel depends on another that, directly or indirectly, depends on the first. In 3-statement models, this usually crops up when you loop in interest expense (on the income statement) that’s based on debt levels (from the balance sheet), which themselves are influenced by net income... which includes interest expense.
Circular references aren’t always wrong, but they can cause unstable calculations, inconsistent results, and endless iteration. To fix it consider using the following methods:
- Use a “plug” for debt or cash: Instead of letting debt float and plugging cash (or vice versa), fix one and let the model balance itself. Many prefer plugging cash into the balance sheet and using excess cash to pay down debt manually.
- Separate interest calculations: Create a separate interest schedule based on beginning-of-period debt balances rather than dynamically linking it to the actual debt figure. It’s a simplification, but a very practical one.
- Enable iterative calculations cautiously: If you really need circular logic (say, for more advanced models), go to Excel Preferences > Formulas > Enable Iterative Calculation. But beware—this can mask errors or make debugging harder.
Remember, cleaner logic > clever logic. Always aim for clarity, especially if someone else will need to read or audit your model later
Types of 3-Statement Modeling Tests
There are 3 different types of 3-statement models. This includes:
- Blank Sheet: This type of test is about working fast. It requires you to use your skills in Excel to find the shortcuts, simplify processes, and make quick decisions while under pressure.
- Template: This type of test requires you to work fast while ensuring accurate formulas, justifying your thought process, and answering questions based on results.
- No Strict Time Limit: This type of test usually is more flexible and allows you to engage in outside research and data to help justify your analysis.
Typically, blank sheet and template tests are done on strict time limits. These time limits can be anywhere from 30 minutes to 4 hours, with the complexity increasing as the time limit grows. The no strict time limit can be for several days or weeks.
What’s the Difference Between DCF and the 3-Statement Model?
DCF (Discounted Cash Flow) models help financial analysts in investment banking, equity research, and private equity value a company. DCF models are valuation models that involve projecting a company’s free cash flows into perpetuity.
A three-statement model is not a valuation model, though it’s sometimes used as a foundation for a DCF model.
A three-statement model is more commonly used with other types of financial models, such as LBO (Leveraged Buyout) models and M&A (Mergers and Acquisitions) models.
Scenario Analysis vs. Sensitivity Analysis
Scenario analysis helps you determine possible financial outcomes based on a set of assumptions or business decisions. Corporate finance professionals use scenario analysis to understand the range of best-to-worst-possible financial outcomes for a variety of scenarios.
Suppose you want to build a complex feature that many customers have been requesting. You need to understand the financial impact of developing this paid feature in two possible, unfortunate scenarios. If:
- Your customers don’t like the paid feature. It doesn’t generate any significant revenue for you, and you lose the money you spent developing it.
- A competitor develops a similar feature and offers it at a lower price.
This is where scenario analysis helps. Just change the relevant figures in your model and see how critical financial parameters, including profitability, capital structure, and cash position, change.
Unlike scenario analysis, sensitivity analysis focuses on the effect of just one variable on the model’s output. Suppose you’re considering increasing the pricing for your base tier.
You want to understand the impact of a price increase on the bottom line. You also want to see if you’ll be able to maintain the right interest coverage ratio and enough cash reserves.
Change the formula to calculate the topline in your model to reflect the pricing change. Changing just this one variable on a three-statement model will show you the impact of price change on profitability, cash reserves, and other critical metrics.
Ready to Build a Three-Statement Model?
The three-statement model is an excellent tool for financial planning and analysis.
Use the three-statement model to identify potential risks and test strategies. Remember, the actual figures may look significantly different, and that’s perfectly normal.
If you don’t want to build a complete model, you can always use forecasting software to model scenarios and assess possible outcomes.
If you found this article helpful, subscribe to The CFO Club Newsletter to receive these insights in your inbox.

