Gross Revenue Retention vs Net Revenue Retention: A Guide

Would you rather run a business that acquires customers super fast but burns through them in a matter of months, or one that takes time to develop new clients but holds onto them for the long haul? Well, it depends. How much do new customers typically spend over their lifetime with your company? How many customers go on to boost their initial spend down the road? How many churn away early?
It’s questions like these that the Key Performance Indicators (KPIs) Gross Revenue Retention (GRR) and Net Revenue Retention (NRR) get to the heart of. If you want to answer that pop quiz without knowing both of these figures… good luck.
In this article, I’ll walk you through what these retention metrics mean, how to calculate them, why they’re important to profitability, and how to boost them whether you’re pre-seed or established.
Gross Revenue Retention: Definition
GRR, aka Gross Dollar Retention, is a metric that tracks how many of your current customers are decreasing their use of your service or platform by canceling or downgrading to a lower spend level. It gives insight into whether your product or service retains its users over time, and also provides intelligence into the quality of your customer service and support services.
How to Calculate Gross Revenue Retention
Calculating GRR is simple. Take your revenue figure from the start of the period you’re tracking, whether that’s a month, quarter, or year. Subtract revenue lost to cancellations and customers downgrading their accounts. Take the resulting figure and divide it by your period’s starting total revenue. Finally, multiply that result by 100. Voila, you’ve got your Gross Revenue Retention rate.
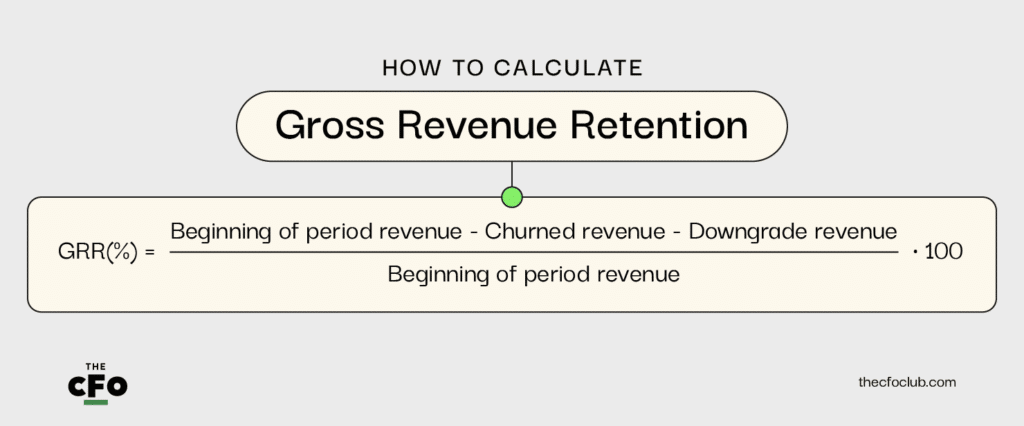
Example: Say you’re running a Software as a Service (SaaS) business offering marketing tools. You start July with $1 million of Monthly Recurring Revenue (MRR). At the end of the month, $50,000 of revenue has churned, and a handful of other customers reduced their subscriptions for an additional $25,000 of lost revenue. The end result: you’re down $75,000 of MRR, which represents a GRR of 92.5%.
Net Revenue Retention: Definition
Net Revenue Retention (NRR), another critical KPI, accounts for customers canceling and reducing their spend as well as those who spend more on your products or services. It’s a fantastic way to track your holistic performance by looking at cross-selling and upsell efficacy alongside the accounts that you lose.
Main Differences from Gross Revenue Retention
GRR: the noise you make when you realize how many customers you’ve lost.
NRR: doesn’t sound like a growl, which means it could be a good thing.
Your Net Revenue Retention rate considers how revenue retention is impacted by customers canceling or downgrading their subscriptions, and how those losses might be offset or outweighed by other customers upgrading to spend more. GRR only reflects how much revenue is lost. No room for outweighing there.
As a metric, GRR really is all about retention. Consequently, it will only ever be 100% or less of starting period revenue. NRR, on the other hand, could exceed 100% of starting revenue because it accounts for clients who opt to increase their spend on your products and services.
One benefit NRR offers is that it gives more of a full-fledged picture of Customer Lifetime Value (LTV) than GRR. If you’re just looking at GRR, sure, you’ll get a sense of how many customers are canceling or shrinking their orders. A high churn rate is obviously bad, but if you’re only burning through small fries while other customers graduate their spending to the big leagues, your perspective and priorities might change.
According to startup lender SaaS Capital, the industrywide median NRR benchmark in 2023 is 102%, while the median GRR is 91%. The color commentary here is that your average SaaS company loses almost 10% of its revenue to customers decreasing or canceling their subscriptions, but revenue gained due to other customers expanding their subscriptions more than makes up for it.
For another perspective, Userpilot, itself a provider of SaaS tools focusing on product analytics and user engagement, estimates median public company NRR as of 2021 at a benchmark of 114% with private companies in the 60% to 148% range (wide range, I know). They estimate the median private firm GRR at 88% to 90%.
How to Calculate Net Revenue Retention
Calculating NRR is only slightly more complicated than GRR. Take total starting revenue for the period, subtract revenue lost to churn and customer downgrades, then add additional revenue from upselling and cross-selling to existing customers. Divide the resulting figure by your total starting revenue, and multiply by 100. Like GRR, NRR doesn’t consider new customers over the analysis period.
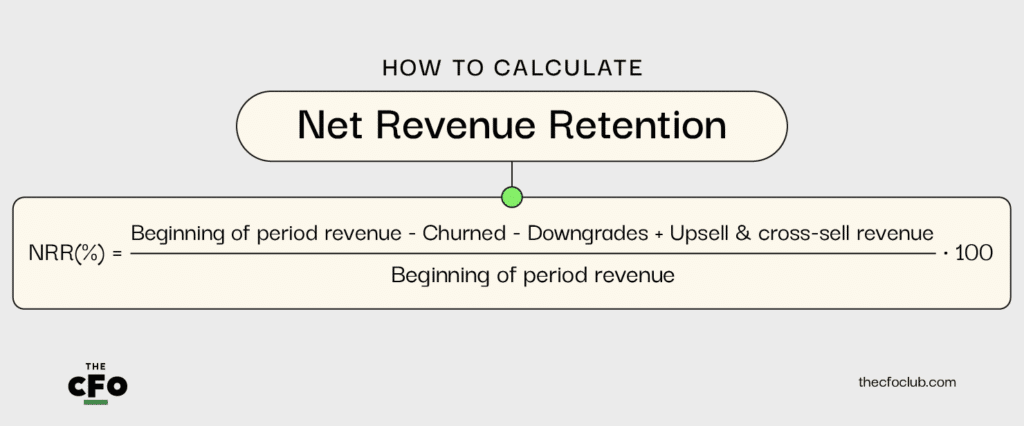
Following up from the example above, if your marketing tool SaaS business started with $1m in revenue in July, lost $75,000 due to churn and decreased orders, but saw customers spend $40,000 more on upsell and $40,000 more on cross-sell opportunities, your NRR would be 100.5%.
Significance of Gross Revenue Retention
While NRR is a multifaceted retention metric showing the effectiveness of your overall customer retention, upsell, and cross-sell performance, GRR is also useful for gauging overall profitability.
It is a critically important KPI for businesses that offer SaaS or other subscription-based products and services in particular. After all, if you’re selling one-off purchases like real estate or cars, you likely won’t have the kind of periodic recurring revenue from the same accounts needed to generate accurate and useful GRR numbers.
Here are a few particularly relevant use cases:
Gauging the Downturn Resistance of Your Business
GRR will always be a more conservative figure than NRR, so it has particular utility when you want to get a sense of how recession-proof your business is.
Speaking in generalities, during a marketwide downturn, customers are unlikely to increase their spending. Instead, there is a big chance they may seek to decrease expenses by cutting down or eliminating spending in certain areas. Consequently, tracking revenue attrition from a group of customers over time can help get a sense of how sensitive your business is to a downturn.
Identifying a Loyal Customer Base
Competitors come and go and markets move up and down, but customers that are sufficiently loyal are likely to stay with you for the long run. GRR is a useful yardstick for customer loyalty, particularly if you can track it alongside the arrival and expansion of other businesses in your niche. If you want to know how sticky a particular type of customer is, you can pair it with cohort analysis and get a full picture.
Improving Your Customer Experience Across the Board
Finally, a GRR that moves up or down can provide useful intelligence into the overall quality of your offering, your user experience, and your customer satisfaction as a whole. Just by eyeballing your GRR month over month or quarter over quarter, you’ll get a high-level sense of whether you’re moving in the right direction or the wrong one, without being distracted by the effectiveness of new sales and marketing activities.
Factors Influencing Gross Revenue Retention
Your GRR is influenced by a number of important internal and external factors. Here are a few of the most impactful ones to track.
Do Your Offerings Provide Lasting Value?
If your products don’t add value over time, your customers will not continue to use them. This can be very telling for your fundamental business model in early-stage companies. It’s entirely possible that your product or service could be a rock star in the first couple of months, but drop off fast after that.
Within my industry, real estate technology, an example of this could be a company that offers a hypothetical service helping out-of-state investors break into new geographic markets. Your customers may have a great experience using your service to jump from New York to Miami, but unless they keep expanding to new markets after that, say goodbye to recurring revenue from these clients.
Is Your Pricing Supported by the Market?
Even if you’re adding a ton of value for your users, you may still experience poor GRR if your pricing is out of touch with what the market will bear. Perhaps your pricing model was out of sync from day one, but it’s also possible that new competitors pop up, increasing pricing competition.
How Effective are Your Customer Success and Support Efforts?
The extent to which you offer valuable ancillary services to your customers will have a big impact on GRR. If your team is there at all times to answer their questions, deliver training, and generally ensure that your users feel like a million bucks, fewer of your customers will axe their subscriptions.
What’s the State of the Market and Your Competitors?
“Blaming it on the market” is easy to call a cop-out, but it’s absolutely relevant to how effectively you retain revenue. If the market tanks, people will spend less money, and that includes your customers. On the other hand, if the sailing is smooth, customer retention will get quite the boost as well.
This one isn’t just about upturns and downturns, either. The arrival of new competitors, especially those that offer game-changing capabilities or economies of scale, can have a massive impact on GRR. Do you think low-cost content mills saw their GRR go up or down when ChatGPT arrived on the scene?
Strategies To Maximize Revenue Retention
Both GRR and NRR are KPIs with many levers. If you want to boost your retention rate—and why wouldn’t you—here are a few strategies to consider.
Ask Them What Went Wrong
Your ability to iterate and make informed decisions is only as good as your ability to properly diagnose what’s going wrong in the first place. If your revenue retention is suffering, it could be any one of the factors listed above, but which one is it, in your specific situation, this time around? You need to uncover problems in your system, wherever they may be.
Consider directly asking users what’s working and what isn’t; if you don’t ask, you won’t learn. This could be a simple survey or a question your sales team asks during a checkup. Then, if clients leave or downgrade their subscription, ask them what prompted their departure. Did they discover an attractive competitor, eliminate their active need, or experience problems getting support?
Delete User Friction Wherever Possible
From the first discovery call to the day they sign a contract to every time they use your service, there are so many opportunities for your users to encounter friction. It could be a sales process that’s too pushy, vague, or confusing. It could be recurring technical issues. Maybe it’s an intrusive, obnoxious email sequence.
All of these points of friction add up to a negative user experience. Even if one or two of them might not sink the ship, taken collectively, these hassles and gripes can cause a lot of damage. Don’t let them! Continually audit your processes and your customer journey to ensure that these pitfalls stay rare or nonexistent.
Rescue Accounts on the Verge of Churning
Revenue isn’t lost until it’s lost. A customer on the verge of canceling their subscription is, from another angle, a prospect you could potentially re-engage before they go. This could be as simple as offering a discounted subscription to customers that click on your cancellation page, or it could be a direct call from your sales team to discuss making a fundamental change to their account.
Encourage users to consider downsizing their spend instead of dropping it cold turkey. Customers who spend less are a lot better than customers who spend zero.
For NRR, Align Compensation with Growth Outcomes
As a function of lost revenue as well as expanded engagements, NRR touches many teams within your business. You likely already reward your sales staff for expanding the commitment of existing customers, so why not also reward your customer success staff with variable compensation?
Wrapping it Up
As with most business metrics, the longer you track GRR and NRR, the more valuable insights they’ll reveal. Here’s a question: Are you already tracking GRR and NRR, and do you have a strong preference for one or the other? I’d love to hear about it on LinkedIn.
If this article was useful, subscribe to the CFO Club newsletter for more content by experts, for experts.
