21 Best Domo Alternatives in 2026

Domo Alternatives Shortlist
Here's my pick of the 10 best software from the 21 tools reviewed.


The best Domo alternatives offer customizable and user-friendly financial dashboards, real-time data integration, and flexible reporting features that help you manage complex and large financial datasets with confidence. If you’re searching for Domo alternatives, you likely need a solution that supports accurate, timely financial reporting and gives your team clear visibility into key metrics, advanced analytics, and actionable insights.
This list will help you compare leading financial dashboard software options, so you can find a platform that fits your reporting requirements, integrates with your existing systems, and supports your organization’s financial goals.
What is Domo?
Domo is a cloud-based financial dashboard software that connects, visualizes, and analyzes data from multiple sources in real time. It helps finance teams create interactive dashboards, automate reporting, and monitor key performance indicators.
Domo is used to improve financial visibility, support decision-making, and streamline data workflows across organizations. Its integrations and customizable features make it a popular choice for businesses managing complex financial data.
Best Domo Alternatives Summary
This comparison chart summarizes pricing details for my top Domo alternatives selections to help you find the best one for your budget and business needs.
| Tool | Best For | Trial Info | Price | ||
|---|---|---|---|---|---|
| 1 | Best for interactive visual analytics dashboards | Free trial available | From $15/user/month (billed annually) | Website | |
| 2 | Best for flexible data exploration with associative analysis | 30-day free trial | From $300/month (10 users, billed annually) | Website | |
| 3 | Best for modeled analytics and embedded reporting on Google Cloud | Free plan available | From $9/user/project/month | Website | |
| 4 | Best for large-scale analytics with in-chip processing | 7-day free trial + free demo available | From $399/month | Website | |
| 5 | Best for scalable AWS analytics with pay-per-user pricing | Free plan available | From $3/user/month | Website | |
| 6 | Best for open-source data exploration and visualization | Free to download | Free and open-source | Website | |
| 7 | Best for Microsoft-based reporting and live data tracking | Free plan available | From $14/user/month (billed annually) | Website | |
| 8 | Best for open-source BI with a simple query builder | Free plan and 14-day free trial | From $100/month + $6/month per user (Includes first 5 users) | Website | |
| 9 | Best for search-based analytics and AI-driven insights | 14- free day trial + free demo available | From $50/user/month (billed annually) | Website | |
| 10 | Best for enterprise reporting across complex operations | Free demo available | Pricing upon request | Website |
Why Trust Our Software Reviews
We’ve been testing and reviewing financial software since 2023. As finance specialists ourselves, we know how critical and difficult it is to make the right decision when selecting software.
We invest in deep research to help our audience make better software purchasing decisions. We’ve tested more than 2,000 tools for different finance use cases and written over 1,000 comprehensive software reviews. Learn how we stay transparent & our software review methodology.
-

LiveFlow
Visit WebsiteThis is an aggregated rating for this tool including ratings from Crozdesk users and ratings from other sites.4.9 -
Float Financial
Visit WebsiteThis is an aggregated rating for this tool including ratings from Crozdesk users and ratings from other sites.4.1 -
Creatio CRM
Visit WebsiteThis is an aggregated rating for this tool including ratings from Crozdesk users and ratings from other sites.4.7


Domo Alternatives Reviews
Below are my detailed summaries of the Domo alternatives that made it onto my shortlist. My reviews offer a detailed look at the features, integrations, and pricing of each software to help you find the best one for you.
Tableau is designed for finance teams and analysts who need to turn complex financial data into clear, interactive dashboards. Its flexible visualization options help you uncover trends, monitor KPIs, and share insights with stakeholders across your organization.
Who Is Tableau Best For?
Finance professionals and analysts at mid-sized to large organizations need advanced data visualization and dashboard customization.
Why Tableau Is a Good Domo Alternative
I picked Tableau for this list because of its depth in visual analytics and interactive dashboard design. I like how Tableau's drag-and-drop interface lets my team build custom financial dashboards without writing code, pulling live data from sources like SQL databases and spreadsheets.
I also appreciate Tableau's calculated fields feature, which lets me create custom financial metrics directly within a visualization. In practice, that means my team can build variance analysis dashboards that update automatically as new data flows in.
Tableau Key Features
- AI-powered predictions: Tableau integrates with R, Python, and MATLAB to run predictive models and visualize results directly within dashboards.
- Natural language querying: Ask data questions in plain language and get instant visual answers without building a chart manually.
- Dashboard accelerators: Pre-built, industry-specific dashboard templates you can deploy and populate with your own financial data.
- Offline data access: Tableau Desktop lets you connect to, explore, and analyze data without an internet connection.
Tableau Integrations
Integrations include Salesforce, Google Analytics, Amazon Redshift, Microsoft Excel, Snowflake, Oracle, SAP, Google BigQuery, Microsoft SQL Server, and Dropbox.
Pros and Cons
Pros:
- Extensive library of pre-built dashboard templates
- Strong support for live data connections
- Advanced visualization options for financial data
Cons:
- Limited write-back capabilities for data input
- Requires separate licenses for server deployment
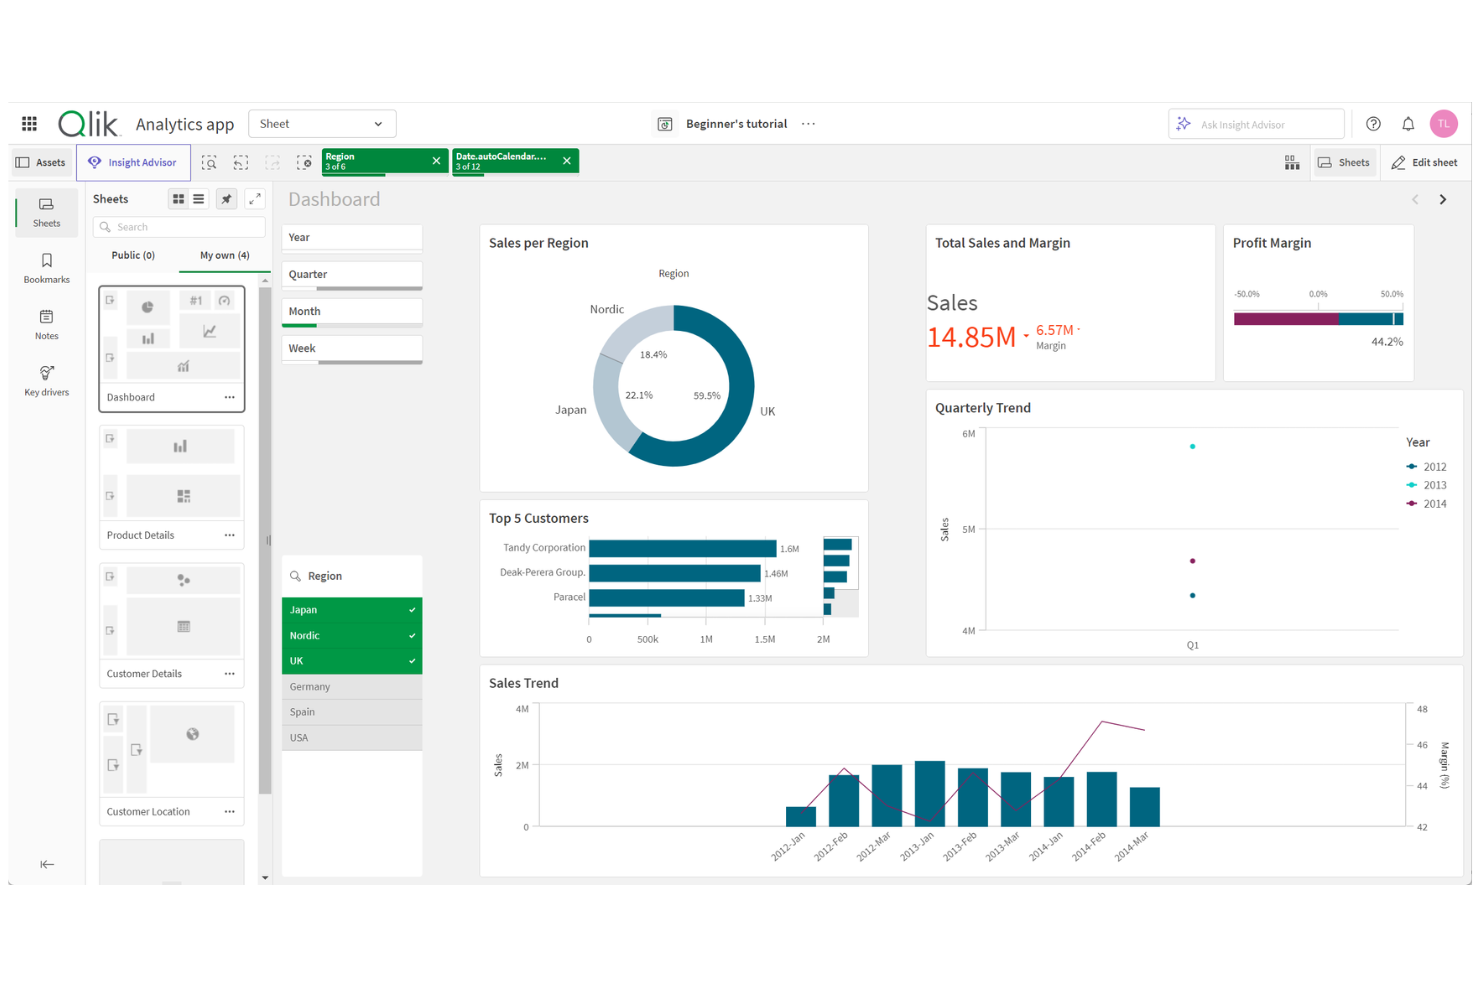
Qlik is a data analytics platform designed for finance teams and analysts who need to explore and visualize complex financial data from multiple sources. Its associative engine helps users uncover hidden trends and relationships that traditional dashboards might miss.
Who Is Qlik Best For?
Finance and analytics teams at mid-sized to large enterprises needing advanced in-memory data exploration across multiple sources.
Why Qlik Is a Good Domo Alternative
I picked Qlik because its associative engine lets my team explore financial data in ways that linear query-based tools simply don't allow. Unlike traditional dashboards, Qlik holds all data relationships in memory, so I can click through dimensions—like cost center, period, or entity—and instantly see how selections ripple across every connected metric.
I also appreciate Qlik Sense's smart search, which lets my team type natural language queries directly into a financial dashboard and surface relevant data without building a new report. In practice, that means we can investigate budget variances or revenue anomalies on the fly, without waiting on a data analyst to run a new query.
Qlik Key Features
- Qlik Predict: Run no-code predictive models and what-if scenarios directly within dashboards to forecast financial outcomes like revenue or cost trends.
- Intelligent alerting: Set data-driven alerts that monitor all your data continuously, not just individual visualizations, and trigger automated actions when thresholds are met.
- Scheduled reporting: Build and distribute formatted reports in Microsoft Office and PDF formats on a set schedule, with delivery via email or shared folders.
- Self-governed data catalog: Browse a searchable catalog of analytics-ready datasets with lineage and origin details, so finance teams can locate and trust the data they use.
Qlik Integrations
Integrations include AWS, Google, Microsoft, Snowflake, SAP, Databricks, Cloudera, Salesforce, Oracle, and Teradata.
Pros and Cons
Pros:
- Advanced alerting for real-time financial monitoring
- In-memory analytics supports fast data exploration
- Associative engine uncovers hidden financial relationships
Cons:
- Steep resource requirements for large deployments
- Visualizations can require manual fine-tuning
Looker
Best for modeled analytics and embedded reporting on Google Cloud
Looker is a cloud-based analytics platform built for finance teams and analysts who need to deliver governed, consistent reporting across departments. Its modeling layer appeals to organizations seeking reliable, scalable dashboards that align with company-wide metrics and definitions.
Who Is Looker Best For?
Finance and analytics teams at large organizations need governed, company-wide reporting and consistent metric definitions.
What draws me to Looker is its LookML modeling layer, which lets my team define metrics like gross margin or revenue recognition once and reuse them consistently across every dashboard and report. That single source of truth matters when finance teams across business units need to pull the same KPIs without getting different numbers.
I also appreciate how Looker's Explore feature lets analysts drill from a high-level financial summary down to row-level transaction detail without leaving the dashboard. In practice, that means my team can investigate a variance in operating expenses and trace it back to individual line items in minutes, not days.
Looker Key Features
- Conversational analytics: Ask data questions in natural language using the Gemini-powered chat interface, without needing BI expertise.
- Connected Sheets integration: Explore LookML-modeled data directly within Google Sheets, bringing governed metrics into spreadsheet workflows.
- Scheduled delivery: Set up automated delivery of dashboards and reports on a recurring schedule via email or other destinations.
- Role-based user access: Assign viewer, standard, or developer user roles to control what each user can query, build, or administer within the platform.
Looker Integrations
Integrations include BigQuery, Google Sheets, Google Analytics, Vertex AI, Google Workspace, Gmail, Google Drive, Google Meet, Looker Studio, and Connected Sheets.
Pros and Cons
Pros:
- Supports granular row-level data exploration
- Deep integration with Google Cloud Platform
- Governed modeling layer ensures metric consistency
Cons:
- No built-in ETL or data prep tools
- Fewer prebuilt financial dashboard templates
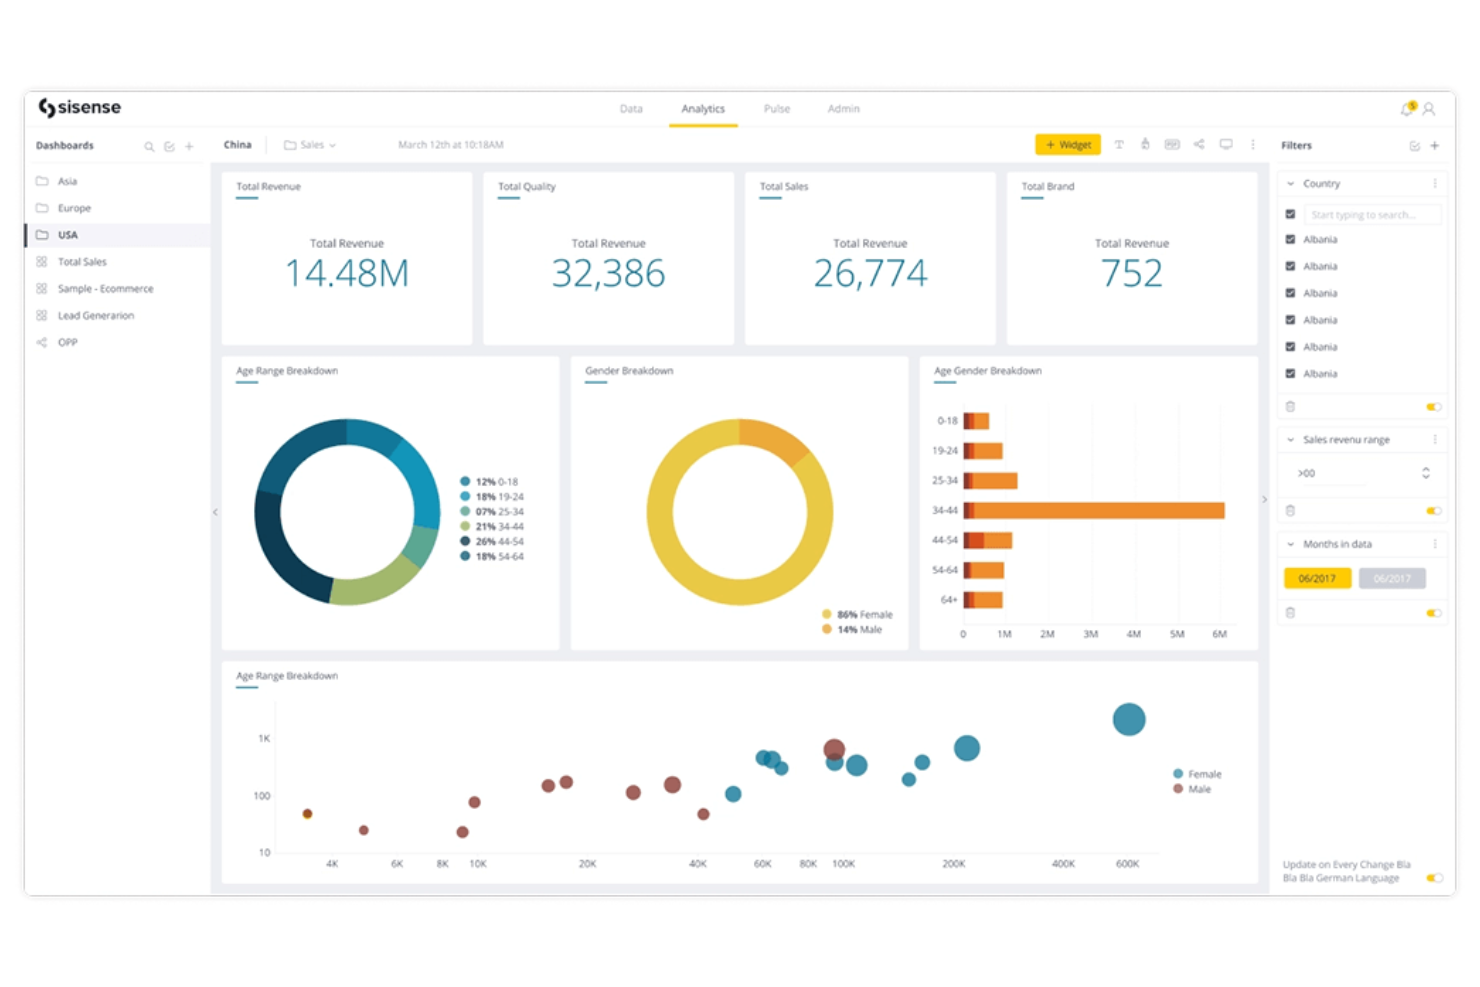
Sisense offers a flexible analytics platform designed for finance teams and product leaders who need to embed dashboards directly into their own applications or workflows. Its customizable approach helps organizations deliver tailored financial insights to users without relying on generic, out-of-the-box reporting.
Who Is Sisense Best For?
Finance and product teams at SaaS companies needing to embed analytics into their own platforms.
Why Sisense Is a Good Domo Alternative
I picked Sisense specifically for its embedded analytics capability, which lets my team build financial dashboards directly into our own internal tools and client-facing applications using Sisense's JavaScript API and SDK. What I appreciate most is the Fusion framework, which allows me to customize the look, feel, and behavior of every dashboard so it matches our product's interface rather than looking like a third-party tool.
In practice, that means finance stakeholders get financial KPIs surfaced inside the platforms they already use daily. For teams that need more than a standalone BI tool, that level of integration flexibility is hard to match.
Sisense Key Features
- AI assistant: Ask data questions in natural language to generate visualizations and summaries without writing queries.
- Data connectivity: Connect to over 400 data sources, with options to consolidate data within Sisense or maintain a live connection to your data warehouse.
- Forecast and trend detection: Surface predictive insights and anomalies within dashboards to help finance teams anticipate changes in key metrics.
- Cloud deployment: Access a cloud-hosted environment with automatic updates and multi-user collaboration on dashboards and data models.
Sisense Integrations
Integrations include Snowflake, Amazon Redshift, Google BigQuery, Microsoft SQL Server, Oracle, Salesforce, Google Analytics, PostgreSQL, MySQL, and MongoDB.
Pros and Cons
Pros:
- Handles large data volumes with in-chip technology
- Highly customizable dashboard design options
- Embeds dashboards directly into web applications
Cons:
- Visualizations require manual configuration
- No built-in ETL or data prep tools
Best for scalable AWS analytics with pay-per-user pricing

Amazon QuickSight is a cloud-native business intelligence platform built for organizations that want to analyze and share financial data at scale within the AWS ecosystem. It appeals to finance teams seeking embedded analytics, interactive dashboards, and scalable reporting directly connected to their AWS data sources.
Who Is Amazon QuickSight Best For?
Finance and analytics teams at AWS-centric enterprises needing scalable, embedded dashboards and reporting.
Why Amazon QuickSight Is a Good Domo Alternative
I picked Amazon QuickSight because its pay-per-session pricing model means my team only pays when someone actually opens a dashboard—not a flat per-seat fee regardless of usage. That makes it far more cost-effective for organizations where finance dashboards are shared broadly across departments but not accessed daily.
I also appreciate SPICE, QuickSight's in-memory calculation engine, which lets my team run fast queries against large financial datasets without putting the load directly on the source database.
For AWS-native stacks, the direct connections to S3, Redshift, and Athena mean we can build and publish financial dashboards without moving data through a separate pipeline.
Amazon QuickSight Key Features
- Embedded analytics: Lets developers embed interactive dashboards and visualizations directly into internal or customer-facing applications using a JavaScript SDK.
- Role-based access controls: Assign data permissions at the user or group level, so finance teams can share dashboards broadly without exposing restricted data.
- Scenario analysis: Allows users to run "what-if" queries in natural language to model financial outcomes and test assumptions without writing code.
- Compliance support: Meets FedRAMP, HIPAA, PCI DSS, ISO, and SOC standards, supporting finance teams operating under strict regulatory requirements.
Amazon QuickSight Integrations
Integrations include Amazon Redshift, Amazon RDS, Amazon S3, Amazon Athena, Amazon Aurora, Amazon DynamoDB, AWS Glue, Salesforce, Snowflake, and ServiceNow.
Pros and Cons
Pros:
- SPICE engine enables fast, large-scale queries
- Native AWS data source integration is seamless
- Pay-per-user pricing reduces unused license costs
Cons:
- Lacks built-in workflow automation features
- A $250/month infrastructure fee applies to Pro user accounts and certain features
Superset is an open-source data exploration and dashboarding platform built for teams that need advanced customization and control over financial analytics. It appeals to finance professionals and data teams who want to design highly tailored dashboards and visualizations for complex reporting needs.
Who Is Superset Best For?
Data and finance teams at mid-sized to large enterprises need open-source dashboarding with advanced customization.
Why Superset Is a Good Domo Alternative
Superset's open-source architecture is what drew me to it as a Domo alternative—my team can self-host the entire platform and configure it to match our exact security and infrastructure requirements.
I appreciate the SQL Lab, which lets analysts write and test custom queries directly against financial databases like Snowflake or BigQuery without leaving the platform. Superset's plugin architecture also lets my team build custom chart types beyond the 40+ built-in options, which matters when standard visualizations don't fit complex financial reporting needs.
Superset Key Features
- Semantic layer: Defines virtual metrics and calculated columns once, making them reusable across all charts and dashboards.
- Role-based access control (RBAC): Assigns dataset and dashboard permissions by role, controlling who can view or edit financial data.
- Native filter bar: Adds interactive cross-dashboard filters so users can slice financial data by time period, region, or category.
- Drag-and-drop dashboard builder: Arranges and resizes charts on a grid layout without writing any code.
Superset Integrations
Integrations include Amazon Redshift, Google BigQuery, Snowflake, Microsoft SQL Server, PostgreSQL, MySQL, Oracle, MongoDB, Apache Druid, and Google Sheets.
Pros and Cons
Pros:
- Active community for troubleshooting and extensions
- Supports advanced SQL-based financial analysis
- Open-source deployment allows full data control
Cons:
- Requires technical setup and ongoing maintenance
- Limited out-of-the-box financial templates
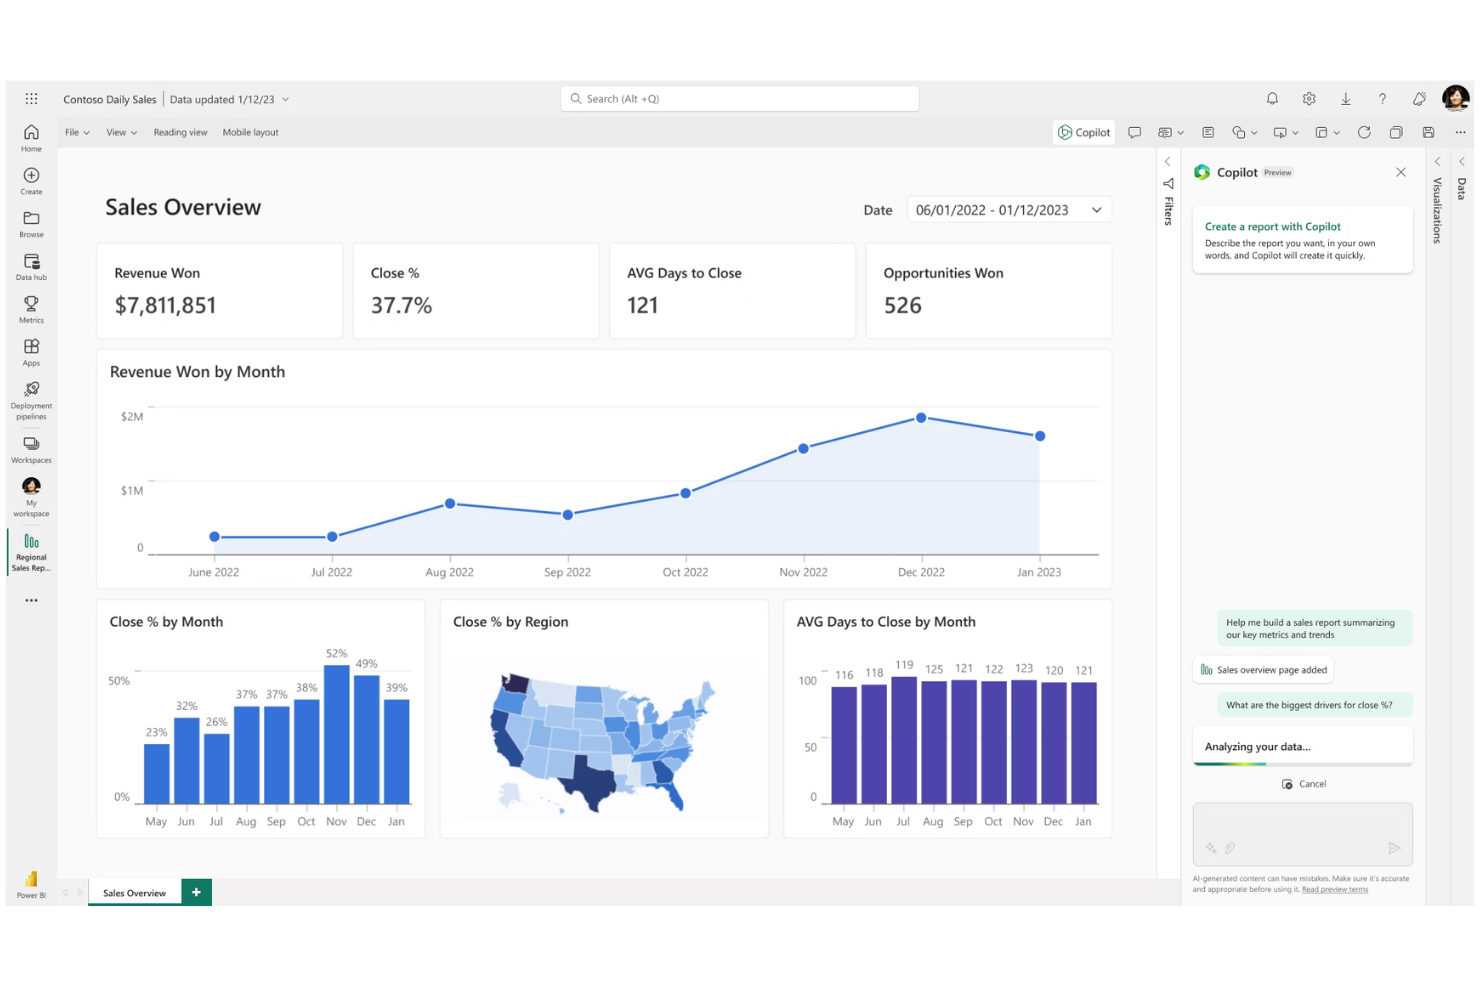
Microsoft Power BI is a business analytics platform built for finance teams and analysts who need to visualize, share, and collaborate on financial data. Its integration with Microsoft 365 tools makes it a strong choice for organizations already using Excel and other Microsoft products.
Who Is Microsoft Power BI Best For?
Finance professionals and business analysts at organizations using Microsoft 365 who need to build and share interactive financial dashboards.
I picked Microsoft Power BI because of how tightly it connects with the Microsoft 365 tools finance teams already use daily. I appreciate that the "Analyze in Excel" feature lets my team pull Power BI datasets directly into Excel to build PivotTables and charts—without leaving the spreadsheet environment.
I also like how Power BI embeds live reports directly into Microsoft Teams and SharePoint, so financial dashboards are accessible inside the collaboration tools my team already works in. In practice, that means my team can share budget variance reports or cash flow dashboards without requiring stakeholders to log into a separate BI platform.
Microsoft Power BI Key Features
- DAX query view: Write, run, and debug DAX calculations directly within the Power BI interface to build custom financial metrics and measures.
- OneLake data hub: Centralize datasets from multiple sources into a single, governed data repository that teams can search, endorse, and reuse.
- Power BI Report Server: Deploy and manage reports on-premises for organizations with data residency or compliance requirements.
- Sensitivity labeling via Microsoft Purview: Apply data classification labels to reports and datasets to enforce access controls across financial content.
Microsoft Power BI Integrations
Integrations include Microsoft Excel, Microsoft Teams, SharePoint, Dynamics 365, Azure Synapse Analytics, Salesforce, Google Analytics, SAP HANA, Oracle Database, and Microsoft OneDrive.
Pros and Cons
Pros:
- Flexible on-premises and cloud deployment options
- Strong Excel-based data modeling capabilities
- Deep integration with the Microsoft 365 ecosystem
Cons:
- Limited real-time collaboration on dashboards
- Complex licensing for enterprise deployments
Metabase offers open-source analytics and dashboarding designed for finance teams that want self-service access to data without heavy IT involvement. It appeals to organizations seeking to empower analysts and business users to explore, visualize, and share financial insights quickly.
Who Is Metabase Best For?
Finance and analytics teams at startups and mid-sized companies seeking open-source, self-service dashboarding.
Why Metabase Is a Good Domo Alternative
I picked Metabase because its open-source foundation gives finance teams direct control over how analytics are deployed, without being locked into a proprietary platform. The visual query builder lets analysts build financial queries using joins and aggregations without writing SQL, which means non-technical stakeholders can explore budget or revenue data independently.
I also appreciate the row-, table-, and dashboard-level permissions, which let my team control exactly who sees sensitive financial data. For teams that want self-service analytics without enterprise overhead, that combination is hard to match.
Metabase Key Features
- Metabot AI: An AI-powered assistant that answers data questions in plain language directly within Metabase Cloud.
- Drill-through: Lets users click into any chart to explore underlying data without building a new query.
- Automated reports: Schedules dashboard delivery to email or Slack, with alert triggers for data changes.
- CSV upload: Uploads spreadsheet data directly into Metabase for querying and visualization.
Metabase Integrations
Integrations include Amazon Redshift, Google BigQuery, Snowflake, PostgreSQL, MySQL, MongoDB, Google Sheets, SQL Server, Presto, and Druid.
Pros and Cons
Pros:
- Row-level permissions for sensitive financial data
- Visual query builder for non-technical users
- Open-source deployment supports full data control
Cons:
- Scheduled reporting only on paid plans
- No native support for write-back workflows
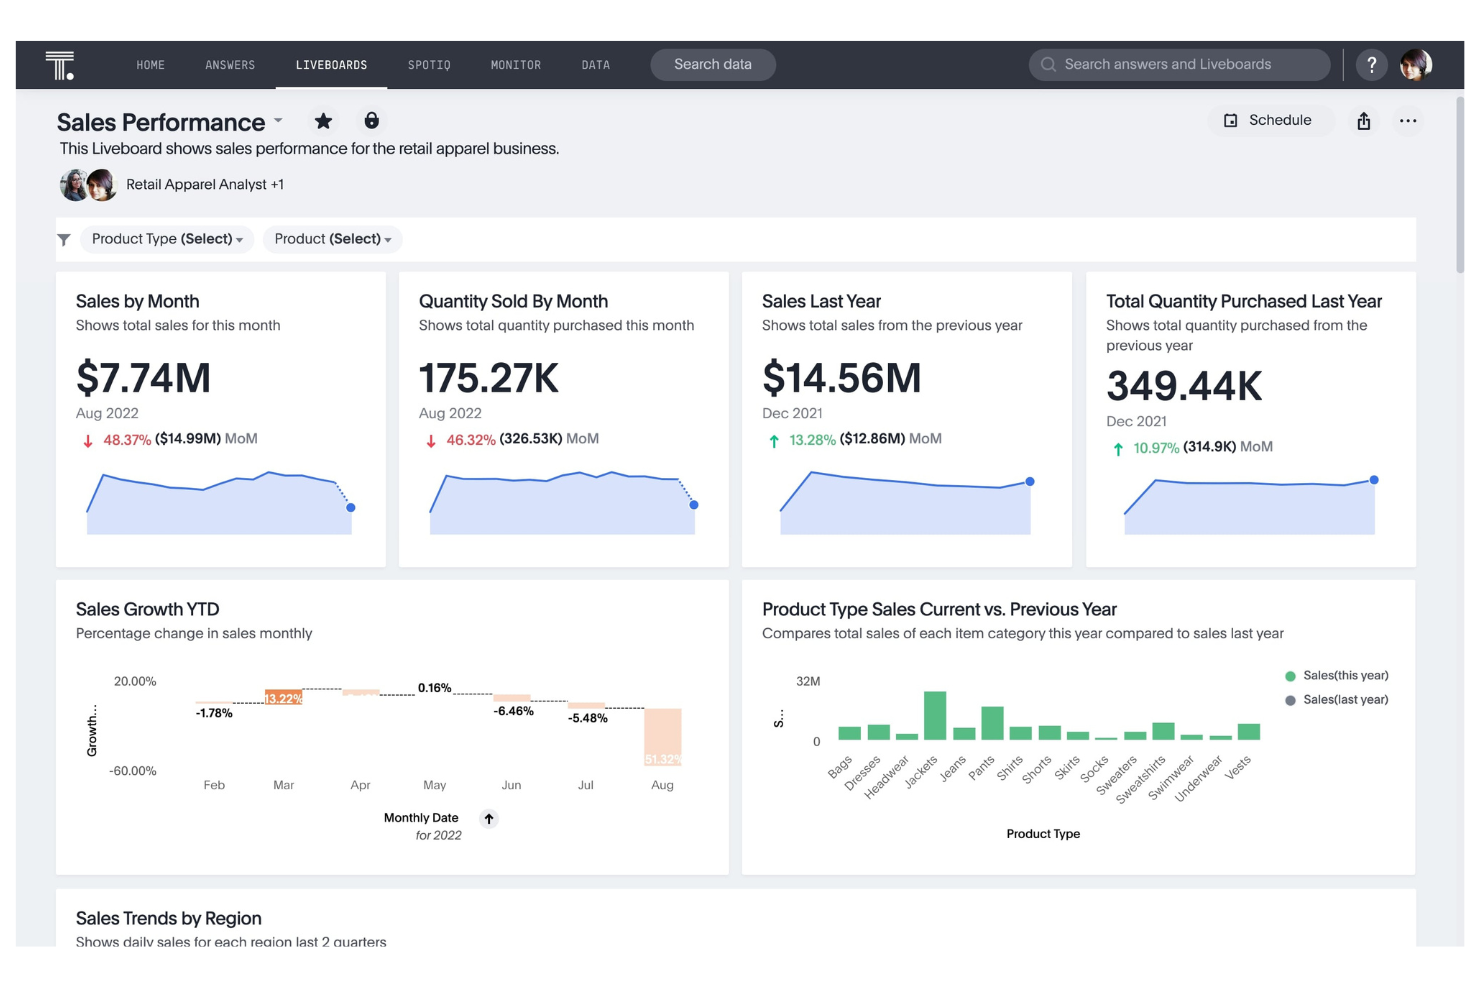
ThoughtSpot offers search-driven analytics designed for finance teams and business leaders who need instant answers from live cloud data. Its intuitive interface appeals to organizations seeking to empower non-technical users to build and share financial dashboards on demand.
Who Is ThoughtSpot Best For?
Finance and operations teams at mid-market and enterprise companies needing live, search-driven analytics.
Why ThoughtSpot Is a Good Domo Alternative
I picked ThoughtSpot because its search-driven approach lets my team type a plain-language question—like "show me revenue by region vs. last quarter"—and get a live answer directly from the cloud data warehouse, with no pre-built report required.
I particularly like Liveboards, ThoughtSpot's interactive dashboard format that queries live data rather than cached snapshots, so finance teams always see current figures without waiting on a refresh cycle. I also appreciate SpotterViz, which generates production-ready dashboards from a natural language prompt in minutes.
For teams moving away from Domo's more rigid dashboard structure, that combination of live querying and on-demand dashboard generation is a meaningful shift.
ThoughtSpot Key Features
- SpotIQ augmented analytics: Automatically detects anomalies, surfaces hidden trends, and generates KPI change analysis using machine learning.
- Relational search: Lets users type natural language queries into a search bar and fine-tune AI-generated answers by editing search tokens without writing SQL.
- Analyst Studio: A code-first workspace where data teams can write SQL, Python, or R to prep, shape, and visualize data within the same platform.
- Spotter AI analyst: A conversational AI agent that answers complex data questions in plain language, with human-in-the-loop feedback to improve accuracy over time.
ThoughtSpot Integrations
Integrations include Snowflake, Databricks, Google BigQuery, Amazon Redshift, Microsoft Azure Synapse, Google Sheets, dbt, Fivetran, Alation, and DataRobot.
Pros and Cons
Pros:
- AI-powered anomaly and trend detection
- Live querying of cloud data warehouses
- Search-driven analytics for instant data answers
Cons:
- No built-in workflow automation tools
- Limited visualization customization options
Best for enterprise reporting across complex operations

SAP BusinessObjects BI Suite is a reporting and analytics platform designed for large organizations that need to manage complex financial data and regulatory requirements. It appeals to finance teams seeking advanced reporting, governed data access, and deep integration with SAP enterprise systems.
Who Is SAP BusinessObjects BI Suite Best For?
Finance and analytics teams at global enterprises using SAP for core business operations.
Why SAP BusinessObjects BI Suite Is a Good Domo Alternative
I picked SAP BusinessObjects BI Suite because it connects directly to SAP ERP and S/4HANA without requiring data exports or third-party connectors, which means my team can build financial dashboards that reflect live transactional data. I appreciate Crystal Reports for pixel-perfect financial statements that meet strict formatting requirements for board reporting and regulatory submissions.
For organizations already running SAP, the semantic layer in BusinessObjects lets my team define consistent financial metrics once and reuse them across reports, so there's no risk of different departments calculating KPIs differently.
SAP BusinessObjects BI Suite Key Features
- Ad hoc reporting: Lets business users run on-demand queries against live data sources without IT involvement.
- Role-based dashboards: Delivers interactive dashboards tailored to specific user roles, controlling what data each stakeholder sees.
- Office integration: Connects multidimensional data analysis directly into Microsoft Excel and PowerPoint for large-scale data filtering and trend identification.
- Cross-enterprise sharing: Distributes reports and dashboards across teams and departments through built-in sharing and scheduling tools.
SAP BusinessObjects BI Suite Integrations
Integrations include SAP S/4HANA, SAP ERP, SAP BW, SAP HANA, Microsoft Excel, Microsoft PowerPoint, Salesforce, Oracle Database, IBM Db2, and Teradata.
Pros and Cons
Pros:
- Strong data governance and security controls
- Pixel-perfect reporting with Crystal Reports
- Deep integration with SAP enterprise systems
Cons:
- Limited self-service dashboard capabilities
- Outdated user interface compared to Domo
Other Domo Alternatives
Here are some additional Domo alternative options that didn’t make it onto my shortlist, but are still worth checking out:
- Strategy One
For performance management and strategic planning
- Zoho Analytics
For self-service BI with automated data blending
- TapClicks
For unified marketing analytics and reporting
- Grow
For no-code BI dashboards for SMBs
- Holistics
For data modeling and self-service reporting
- Luzmo
For interactive embedded dashboard design
- GoodData
For scalable embedded analytics
- Grafana
For real-time monitoring across diverse data sources
- Draxlr
For SQL-based reporting for startups
- Cometly
For marketing attribution and ad analytics
- Dot
For AI-powered automated business insights


Domo Alternatives Selection Criteria
When selecting the best Domo alternatives to include in this list, I considered common buyer needs and pain points related to financial dashboard software products, like consolidating data from multiple sources and enabling secure, role-based access to sensitive financial information. I also used the following framework to keep my evaluation structured and fair:
Core Functionality (25% of total score)To be considered for inclusion in this list, each solution had to fulfill these common use cases:
- Visualize financial KPIs and metrics
- Connect to multiple data sources
- Schedule and automate report delivery
- Enable interactive dashboard filtering
- Export dashboards and reports
Additional Standout Features (25% of total score)To help further narrow down the competition, I also looked for unique features, such as:
- Built-in forecasting and scenario modeling
- Customizable role-based access controls
- Support for embedded analytics
- Advanced audit logging and compliance tools
- White-label dashboard branding
Usability (10% of total score)To get a sense of the usability of each system, I considered the following:
- Intuitive drag-and-drop dashboard builder
- Clean and modern interface design
- Minimal clicks to access core features
- Responsive design for mobile and desktop
- Clear navigation and menu structure
Onboarding (10% of total score)To evaluate the onboarding experience for each platform, I considered the following:
- Availability of step-by-step product tours
- Access to pre-built dashboard templates
- Comprehensive training videos and documentation
- Live webinars or onboarding sessions
- In-app chatbots for onboarding support
Customer Support (10% of total score)To assess each software provider’s customer support services, I considered the following:
- 24/7 support availability
- Dedicated account manager or success team
- Fast response times to inquiries
- Access to user community or forums
- Detailed online knowledge base
Value For Money (10% of total score)To evaluate the value for money of each platform, I considered the following:
- Transparent and flexible pricing plans
- No hidden fees or surprise charges
- Discounts for annual or volume commitments
- Free trial or freemium option available
- Features included at each pricing tier
Customer Reviews (10% of total score)To get a sense of overall customer satisfaction, I considered the following when reading customer reviews:
- Consistent positive feedback on reliability
- Praise for customer support quality
- Reports of ease of integration
- Satisfaction with dashboard customization
- Noted improvements in reporting efficiency
Why Look For A Domo Alternative?
While Domo is a good choice of financial dashboard software, there are a number of reasons why some users seek out alternative solutions. You might be looking for a Domo alternative because you need…
- More control over data hosting and security
- To ditch the high costs without sacrificing advanced features
- Advanced customization options
- Prefer open-source or self-hosted data management systems
- Fewer integration gaps with niche data sources
- A lower learning curve and better ease of use
If any of these sound like you, you’ve come to the right place. My list contains several financial dashboard software options that are better suited for teams facing these challenges with Domo and looking for alternative solutions.
Domo Key Features
Here are some of the key features of Domo, to help you contrast and compare what alternative solutions offer:
- Data connectors: Domo offers hundreds of pre-built connectors to cloud and on-premises data sources, allowing you to centralize financial and operational data from platforms like Salesforce, NetSuite, Google Analytics, and more.
- Magic ETL: This visual data transformation tool lets users clean, join, and prepare data for analysis without writing code, making it easier to build accurate financial dashboards.
- Card builder: Domo’s card builder enables users to create interactive visualizations and dashboards using a drag-and-drop interface, supporting a wide range of chart types and custom layouts.
- Dataflows: Automate complex data processing pipelines by chaining together multiple data transformation steps, ensuring your financial dashboards always reflect the latest data.
- Beast Mode calculations: Create custom metrics and calculated fields directly within the platform using a simple formula editor, supporting advanced financial analysis and reporting.
- Alerts and notifications: Set up automated alerts based on thresholds or anomalies in your financial data, so your team is notified of important changes in real time.
- Mobile app: Access dashboards, reports, and data visualizations on the go with Domo’s native mobile applications for iOS and Android devices.
- Role-based access controls: Manage user permissions at a granular level, ensuring sensitive financial data is only accessible to authorized team members.
- Appstore: Extend Domo’s functionality with pre-built apps and solutions from the Domo Appstore, including industry-specific financial analytics tools.
- Collaboration tools: Share dashboards, comment on data, and assign tasks within the platform to keep financial teams aligned and informed.