

Los 10 mejores programas de análisis estadístico reseñados en 2026

10 Lista de las mejores herramientas de software de análisis estadístico


Como director financiero, estás constantemente haciendo malabarismos con cifras, previsiones e informes. No es ningún secreto que gestionar grandes cantidades de datos puede resultar abrumador. Ahí es donde entra en juego el software de análisis estadístico, que te ayuda a dar sentido al caos.
Según mi experiencia, estas herramientas ofrecen claridad y precisión, y convierten los datos sin procesar en información práctica. Pueden transformar tu proceso de toma de decisiones y proporcionar un apoyo valioso a tu equipo financiero.
En este artículo, compartiré mis principales selecciones del mejor software de análisis estadístico. Encontrarás reseñas imparciales y bien documentadas, diseñadas para orientarte a la hora de elegir la herramienta adecuada para tus necesidades. Veamos las opciones que pueden ayudarte a aprovechar tus datos financieros.
Por qué confiar en nuestras recomendaciones de software
Nuestras reseñas reflejan nuestro criterio independiente, no un discurso de ventas. Descubra cómo mantenemos la transparencia.
Para esta guía, evaluamos las herramientas mediante pruebas prácticas e investigación independiente, puntuando las herramientas según nuestros criterios de selección.
Nuestras reseñas reflejan nuestro criterio editorial humano, no un discurso de ventas.
Resumen del mejor software de análisis estadístico
Esta tabla comparativa resume los detalles de precios de mis principales selecciones de software de análisis estadístico para ayudarte a encontrar la mejor opción según tu presupuesto y las necesidades de tu empresa.
| Tool | Best For | Trial Info | Price | ||
|---|---|---|---|---|---|
| 1 | Ideal para usuarios de Salesforce | Prueba gratuita disponible | Desde $70/usuario/mes | Website | |
| 2 | Ideal para equipos grandes con habilidades diversas | Prueba gratuita disponible | Desde $99/usuario/mes | Website | |
| 3 | Mejor para limpiar grandes volúmenes de datos | Prueba gratuita disponible | Desde $940/año | Website | |
| 4 | Los mejores paneles | Prueba gratuita disponible | Precio a consultar | Website | |
| 5 | Ideal para usuarios de Microsoft Excel | Prueba gratuita de 14 días | Desde $345/año | Website | |
| 6 | La mejor herramienta para trabajo entre departamentos | Prueba gratuita de 14 días | Desde $0.55/SU/hora | Website | |
| 7 | Mejor para programación avanzada | Not available | Desde $840/año | Website | |
| 8 | Mejor software de análisis estadístico de código abierto | Not available | Gratis | Website | |
| 9 | Mejor para usuarios de Mac | Prueba gratuita disponible | Precio bajo consulta | Website | |
| 10 | Mejor para crear gráficos | Prueba gratuita disponible | Desde $465/año | Website |
Reseñas del mejor software de análisis estadístico
A continuación encontrarás mis resúmenes detallados del mejor software de análisis estadístico que llegó a mi lista de preseleccionados. Mis reseñas ofrecen una visión detallada de las funciones clave, las ventajas y desventajas, las integraciones y los casos de uso ideales de cada herramienta para ayudarte a encontrar la mejor opción para ti.

Tableau
Ideal para usuarios de Salesforce
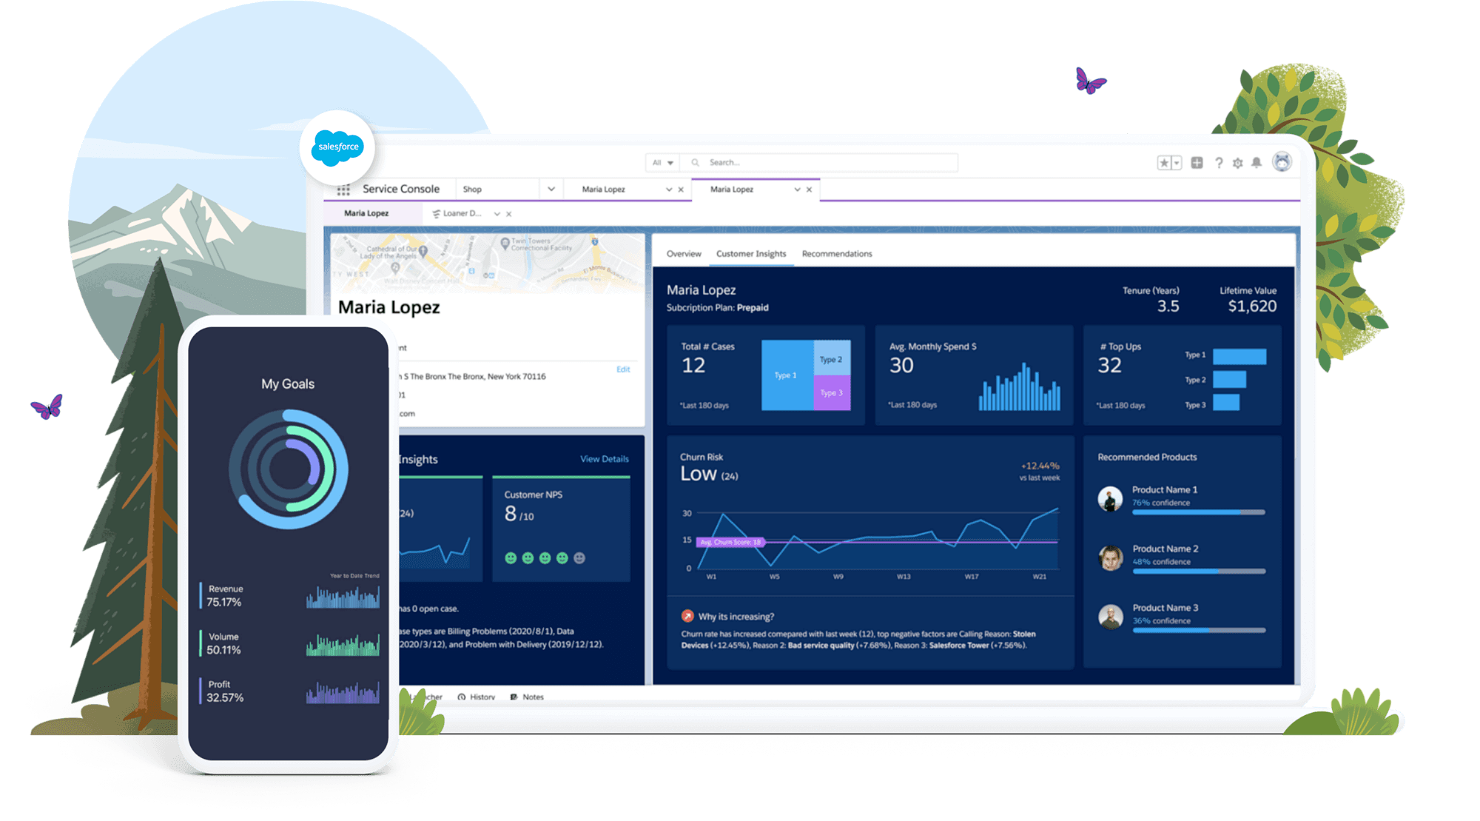
Tableau es la plataforma de análisis visual de Salesforce. Puedes implementarla en tus propios servidores, en la nube o integrarla nativamente con tu Salesforce CRM, lo cual es perfecto si planeas analizar datos de clientes.
Por qué elegí Tableau: La integración nativa de Tableau con Salesforce es un punto de venta importante para cualquier empresa que ya utilice el CRM de la compañía. Prácticamente es el único software de análisis estadístico con este tipo de integración. Por supuesto, también puedes conectar casi cualquier otra fuente de datos a la plataforma. El software también está impulsado por Einstein AI de Salesforce, que te permite usar la herramienta para hacer predicciones impulsadas por inteligencia artificial basadas en tus datos.
Funciones y integraciones destacadas:
Las funciones incluyen el mapeo acelerado de datos, que simplifica la configuración del panel al permitirte mapear fácilmente datos externos. Tu equipo puede beneficiarse de los títulos de eje dinámicos, permitiéndote actualizar los títulos de los ejes en función de los valores de los parámetros. Además, las mejoras en Tableau Prep optimizan la conexión y usabilidad de los datos, haciendo que el proceso de preparación sea más fluido.
Las integraciones incluyen Salesforce, Microsoft Excel, Google Sheets, Amazon Redshift, Snowflake, Google BigQuery, SAP Hana, SQL Server e IBM DB2.
Pros and Cons
Pros:
- Integración nativa con Salesforce
- Gran variedad de integraciones de terceros
- Panel intuitivo con funcionalidad de arrastrar y soltar
Cons:
- Las funciones de visualización podrían mejorarse
- Puede tardar un tiempo en descargar grandes conjuntos de datos

IBM SPSS
Ideal para equipos grandes con habilidades diversas
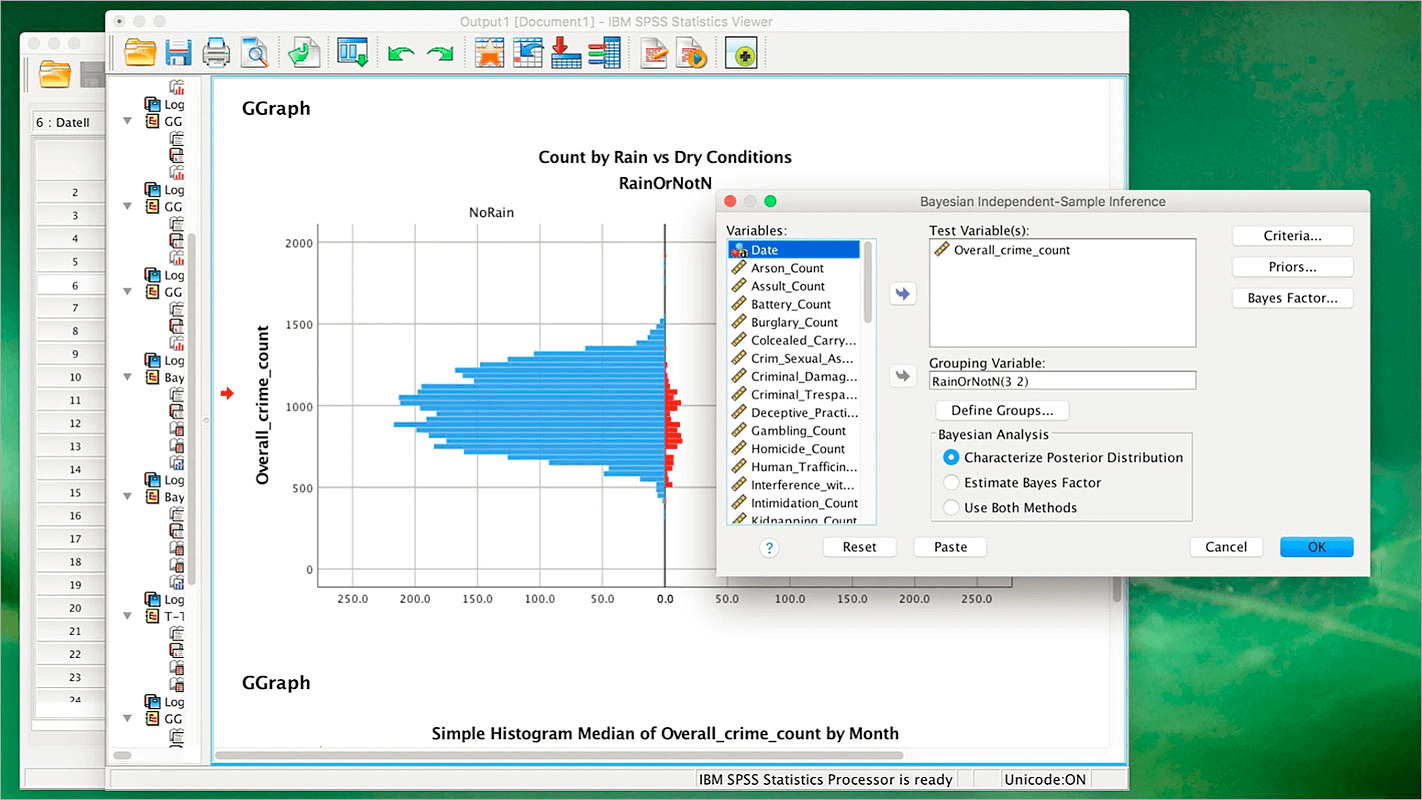
IBM SPSS es una plataforma de software estadístico con una interfaz fácil de usar que permite a los usuarios preparar y analizar datos sin necesidad de saber programar. La herramienta utiliza funcionalidad de arrastrar y soltar para realizar análisis y ofrece una variedad de demostraciones técnicas para ayudarte a comenzar.
Por qué elegí IBM SPSS: Algunas plataformas de software estadístico abruman a los usuarios con una gran cantidad de funciones. Otras limitan las capacidades para atraer a una audiencia principiante. Pero IBM SPSS logra un equilibrio entre ambas, posicionándose como una opción amigable para el usuario mientras ofrece un abanico de funciones integrales (como análisis de regresión). Esto facilita que los analistas sin experiencia se familiaricen con la plataforma, pero también significa que no tendrán que cambiar a otra solución una vez que hayan adquirido experiencia.
Características e integraciones destacadas:
Las características incluyen una interfaz limpia y fácil de usar, y funcionalidad de arrastrar y soltar. Todo lo que los usuarios deben hacer es apuntar y hacer clic en el modelo relevante para ejecutar un análisis sobre sus datos. También hay una gran cantidad de modelos estadísticos para elegir, que van desde funciones básicas como modelado de frecuencias hasta modelado de regresión avanzado, y la plataforma incluso automatiza gran parte del proceso de preparación de datos.
Las integraciones incluyen TIMi y JMP, Voxco Online y Rotator Survey.
Pros and Cons
Pros:
- Interfaz de usuario excelente
- Amplia gama de modelos estadísticos
- Precios competitivos
Cons:
- Faltan algunos modelos muy avanzados
- Las funciones de reporte carecen de flexibilidad

MATLAB
Mejor para limpiar grandes volúmenes de datos
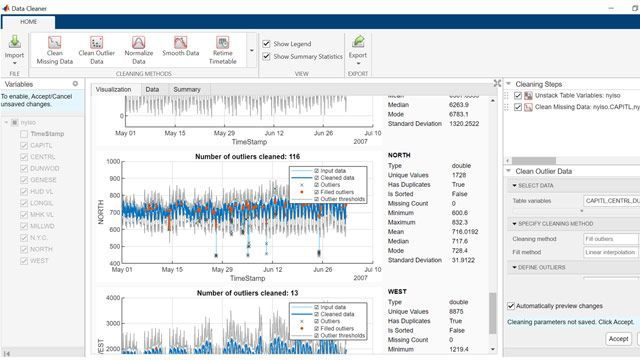
MATLAB es un software de análisis estadístico para la depuración, el análisis y la visualización de datos. El editor en vivo de la plataforma te permite realizar de manera interactiva tareas iterativas como limpiar y etiquetar datos.
Por qué elegí MATLAB: Los datos desordenados pueden arruinar los resultados. Por eso MATLAB es adecuado para cualquier CFO que cuente con un gran conjunto de datos y quiera limpiar y etiquetar la información antes de analizarla a fondo. No te dejes llevar por el hecho de que la herramienta se utiliza principalmente con fines académicos; es muy útil para analizar datos empresariales y generar informes significativos.
Funciones destacadas e integraciones:
Funciones incluyen herramientas integradas para la computación numérica que te permiten analizar datos y crear algoritmos. Puedes visualizar tu trabajo usando gráficos y diagramas personalizables que te ayudan a ver patrones con claridad. MATLAB también te permite escribir scripts y funciones para automatizar tareas y aumentar tu eficiencia.
Las integraciones incluyen Simulink, Excel, Python, C++, Java, Fortran, Amazon Web Services, Google Cloud, ThingSpeak y Arduino.
Pros and Cons
Pros:
- Múltiples herramientas de depuración de datos
- Interfaz gráfica intuitiva
- Creación visual personalizada
Cons:
- Requiere una considerable capacidad de procesamiento para ejecutarse
- La curva de aprendizaje puede ser pronunciada

Domo
Los mejores paneles
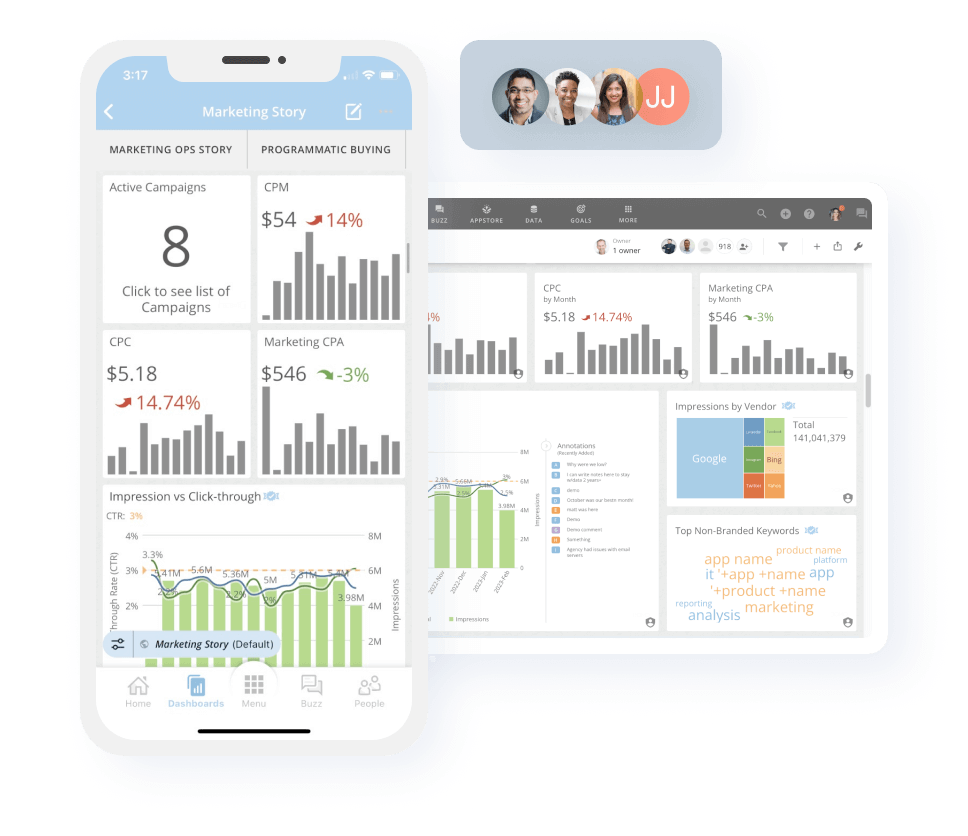
Domo es una plataforma de datos en la nube diseñada para ayudar a todos en tu organización a aprovechar mejor los datos empresariales. Los paneles e informes intuitivos del software facilitan que incluso los analistas principiantes generen conclusiones y utilicen los datos de forma efectiva.
Por qué elegí Domo: De todas las herramientas de software de análisis estadístico en esta lista, Domo es probablemente la más fácil de usar. El software automatiza la extracción de datos, lo que significa que los datos pueden transferirse de hojas de cálculo a paneles en tiempo real, mientras que su analítica embebida incluso te permite compartir paneles externamente con clientes o socios.
Características principales e integraciones:
Características incluyen herramientas de análisis de datos fáciles de usar que facilitan que tú y tu equipo profundicen en los datos, independientemente del nivel de habilidad. El software proporciona técnicas de regresión avanzadas para ayudarte a obtener conclusiones predictivas y tomar decisiones informadas. Además, IBM SPSS ofrece sólidas capacidades de gestión de datos, lo que garantiza que tus datos estén organizados y sean accesibles para el análisis.
Integraciones incluyen conexiones nativas con IBM Cognos Analytics, Microsoft Excel, R, Python, IBM Watson Studio, Hadoop, Apache Spark, Amazon Web Services, Google Cloud y Microsoft Azure.
Pros and Cons
Pros:
- Paneles e informes personalizables
- Alimentación de datos en tiempo real
- Excelente interfaz de usuario
Cons:
- Carece de funcionalidades avanzadas
- El soporte al cliente es deficiente

XLSTAT
Ideal para usuarios de Microsoft Excel
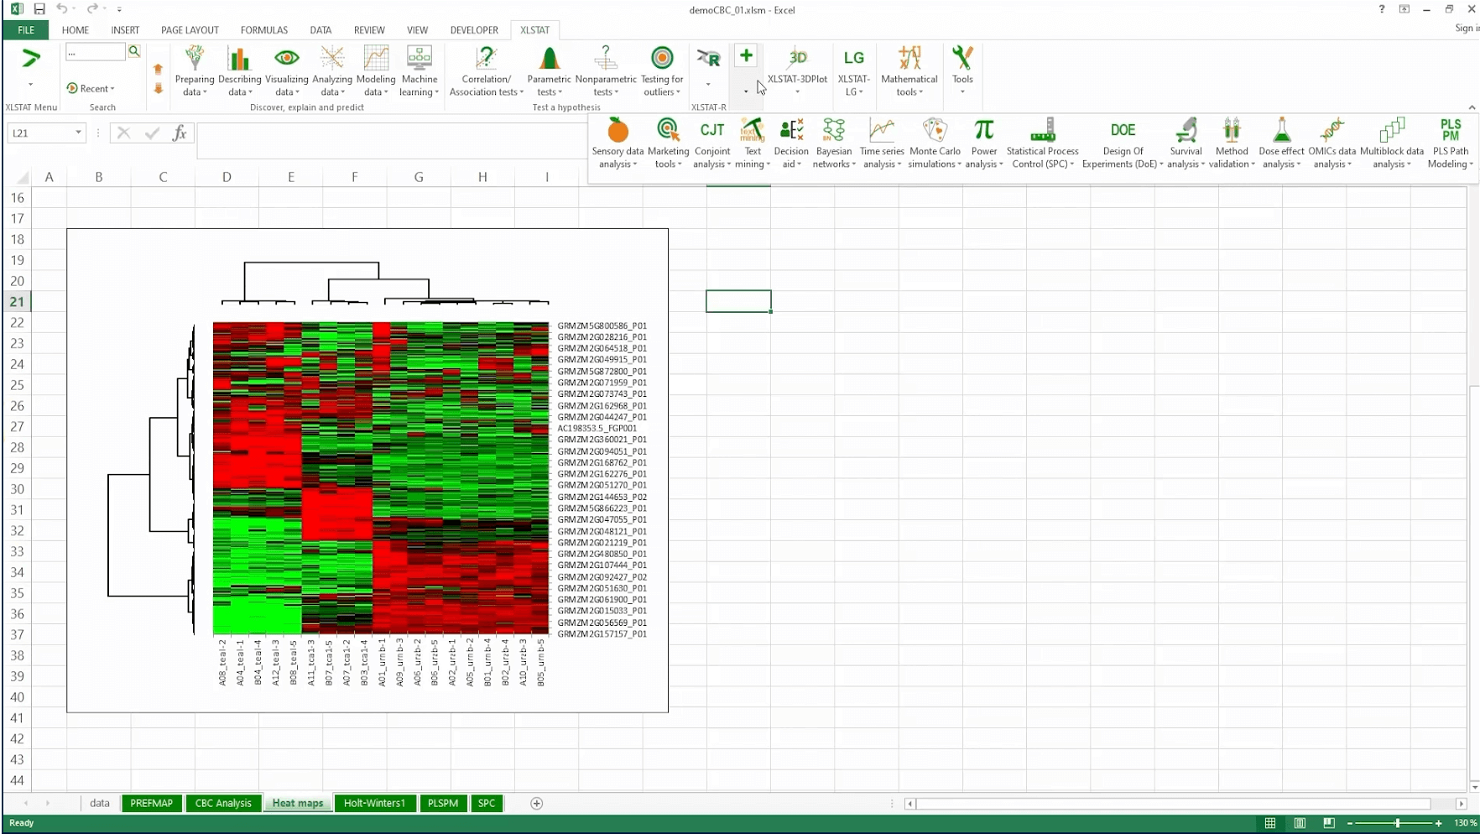
XLSTAT es una solución líder de software de análisis estadístico diseñada específicamente para Microsoft Excel. Se integra de forma nativa en la hoja de cálculo, lo que le permite analizar datos empresariales sin salir de la plataforma.
Por qué elegí XLSTAT: Si la integración nativa con Microsoft Excel no fuera suficiente, los analistas de negocios y directores financieros pueden usar XLSTAT sin necesidad de saber programar. Usted puede generar informes de datos en profundidad y gráficos de Excel personalizables, y replicar muchas de las demás capacidades de otras plataformas en esta lista.
Funciones y integraciones destacadas:
Funciones incluyen una suite avanzada de más de 250 herramientas para análisis de datos. El software también ofrece herramientas avanzadas de aprendizaje automático, permitiendo que su equipo integre scripts de R para tareas sólidas de regresión y clasificación.
Integraciones incluyen Microsoft Excel, Word y PowerPoint.
Pros and Cons
Pros:
- Integración nativa con Excel
- Excelente soporte al cliente
- Fácil de usar
Cons:
- El precio premium puede ser caro
- Puede ser difícil para principiantes

SAS Viya
La mejor herramienta para trabajo entre departamentos
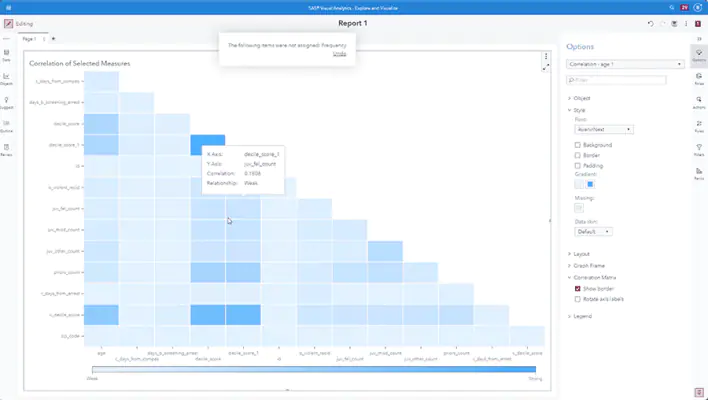
SAS Viya es una plataforma en la nube para IA, análisis de datos y gestión de datos. Puedes integrar datos de casi cualquier fuente y ejecutar funciones colaborativas de preparación y análisis de datos en equipo.
Por qué elegí SAS Viya: La colaboración está en el centro de la plataforma SAS Viya. Con esta herramienta, las empresas pueden crear un espacio compartido donde cualquier miembro del equipo de datos puede trabajar juntos en análisis. Por ejemplo, los ingenieros de datos pueden crear pipelines escalables, los científicos de datos pueden transformar esos conjuntos de datos en datos estructurados y los analistas de negocios pueden usar herramientas analíticas avanzadas para obtener conocimientos.
Funciones y compatibilidades destacadas:
Funciones incluyen capacidades de aprendizaje automático que te permiten obtener información de grandes conjuntos de datos fácilmente. La interfaz interactiva también permite a tu equipo explorar visualmente los datos, mejorando la colaboración y la toma de decisiones.
Integraciones incluyen Microsoft Azure, Amazon Web Services, Google Cloud, Microsoft Office, Hadoop, SAP, Salesforce, IBM y Teradata.
Pros and Cons
Pros:
- Excelentes funciones de colaboración
- Fácil de conectar diferentes fuentes de datos
- Procesamiento muy rápido
Cons:
- Puede resultar costosa según el uso
- No es la plataforma más intuitiva

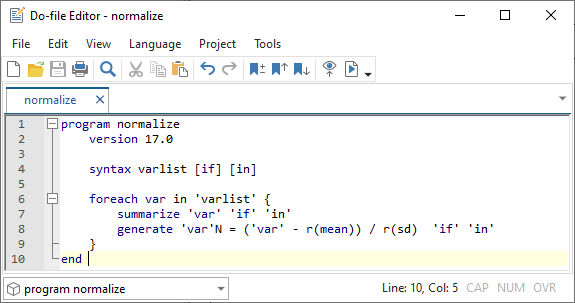
Stata es un paquete de software avanzado que cubre todo el espectro del análisis estadístico, desde la preparación y manipulación de datos hasta la visualización y la generación automática de informes. El programa incluye Mata, un lenguaje de programación avanzado que proporciona soporte directo para la programación matricial.
Por qué elegí Stata: Aunque no necesitas programar para usar Stata, el lenguaje incorporado de la plataforma ofrece a los usuarios avanzados un entorno de desarrollo donde pueden producir y compilar código. La herramienta también ofrece PyStata, una integración con Python que permite integrar Python en tu código.
Características y integraciones destacadas:
Características incluyen modelos estadísticos avanzados que atienden a diversas disciplinas, brindando a tu equipo las herramientas para realizar análisis de datos tanto simples como complejos. Puedes explorar datos con capacidades gráficas mejoradas, lo que facilita visualizar tendencias y patrones. Además, Stata admite el promedio bayesiano de modelos y el análisis de mediación causal, lo cual es valioso para interpretaciones estadísticas matizadas.
Integraciones incluyen Python, R, Excel, SAS, SPSS, MATLAB, SQL Server, PostgreSQL y MySQL.
Pros and Cons
Pros:
- Amplio soporte para lenguajes de programación
- Actualizaciones regulares
- Soporte excepcional
Cons:
- Curva de aprendizaje pronunciada
- No es tan amigable para principiantes como otras herramientas

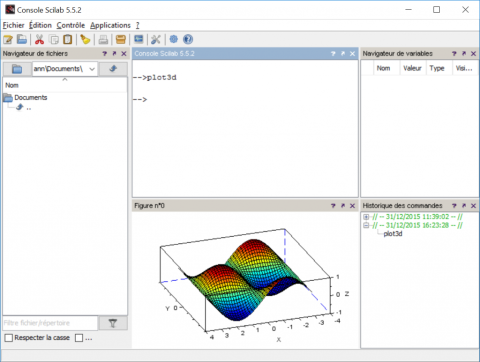
Scilab es un software de análisis estadístico gratuito y de código abierto bajo la Licencia GPL. Esto significa que puedes usar el software para cualquier propósito, modificarlo y compartirlo con colegas.
Por qué elegí Scilab: Scilab es el único software de análisis estadístico en esta lista que puedes utilizar gratis a largo plazo. Pero eso no significa que carezca de funcionalidades. Aun así ofrece muchas de las herramientas y funciones de análisis de datos que necesitas, incluyendo análisis numérico, visualización de datos y simulaciones.
Funciones destacadas e integraciones:
Las funciones incluyen una interfaz fácil de usar que te permite gestionar cálculos y simulaciones complejas con facilidad. Scilab ofrece un conjunto extenso de funciones matemáticas para apoyar tus necesidades computacionales, ayudando a tu equipo a abordar tareas desde aritmética básica hasta cálculo avanzado. Además, su naturaleza de código abierto asegura que puedas personalizar y ampliar el software para adaptarlo a tus requisitos únicos.
Las integraciones incluyen MATLAB, LabVIEW, C++, Java, Python, Fortran, COMEDI y Xcos.
Pros and Cons
Pros:
- Gratis para usar y editar
- Interfaz limpia
- Procesamiento rápido
Cons:
- Le faltan funciones en comparación con productos premium
- No es tan intuitivo de usar

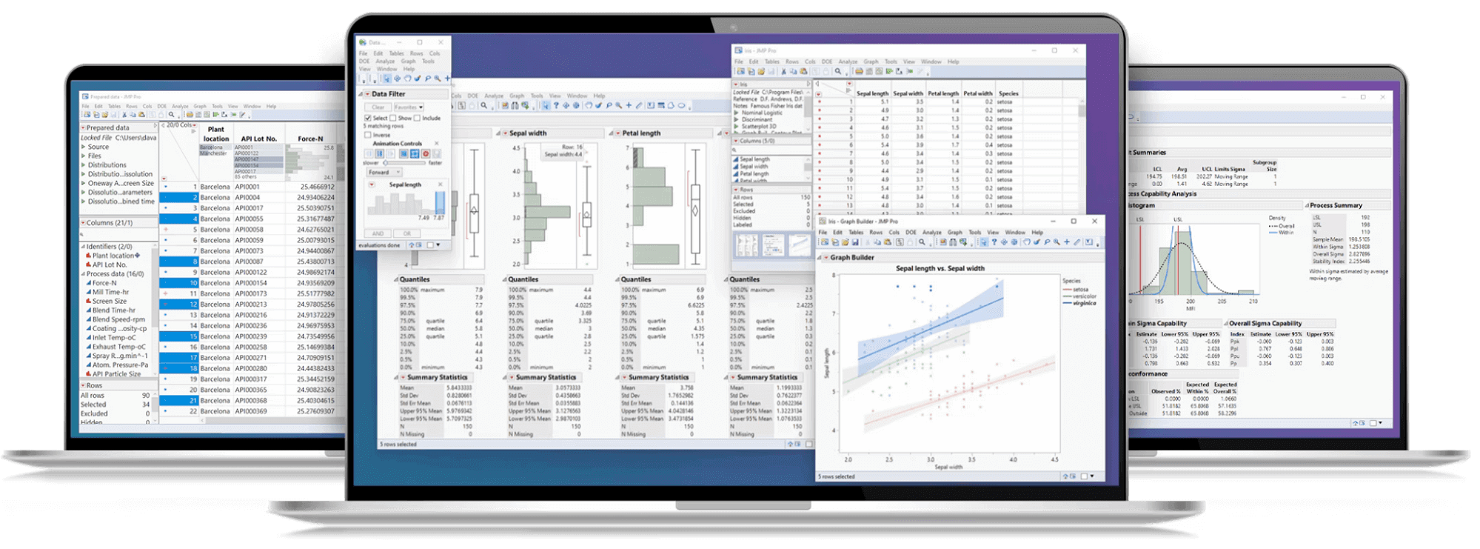
JMP es un software estadístico de escritorio diseñado para adaptarse a todos los niveles de análisis, desde ingenieros hasta analistas de negocios y científicos. Como cabría esperar de cualquier producto para Mac, presenta una interfaz de usuario limpia que facilita que cualquier persona comience a utilizar la herramienta.
Por qué elegí JMP: El cliente nativo para macOS es un punto de venta significativo, dado que no todas las herramientas de análisis estadístico de escritorio funcionan en este sistema operativo. Sin embargo, JMP no se ve limitado por esto. Aun así, obtendrás todas las herramientas necesarias para comprender los datos empresariales a través de una solución sin código.
Características destacadas e integraciones:
Características incluyen herramientas dinámicas de visualización de datos que te permiten explorar rápidamente tendencias y patrones en tus datos. Tu equipo también puede utilizar modelado estadístico integrado para obtener información sin necesidad de habilidades avanzadas de programación. En mi experiencia, los paneles interactivos facilitan compartir hallazgos y colaborar de forma eficaz.
Integraciones incluyen Excel, R, Python, SAS, MATLAB, Minitab, Tableau, JMP Live, SQL Server y Oracle NetSuite.
Pros and Cons
Pros:
- Cliente nativo de Mac disponible
- Excelentes capacidades de paneles
- Amplia gama de gráficos
Cons:
- Puede tener una curva de aprendizaje larga
- Corregir errores y fallos puede ser lento

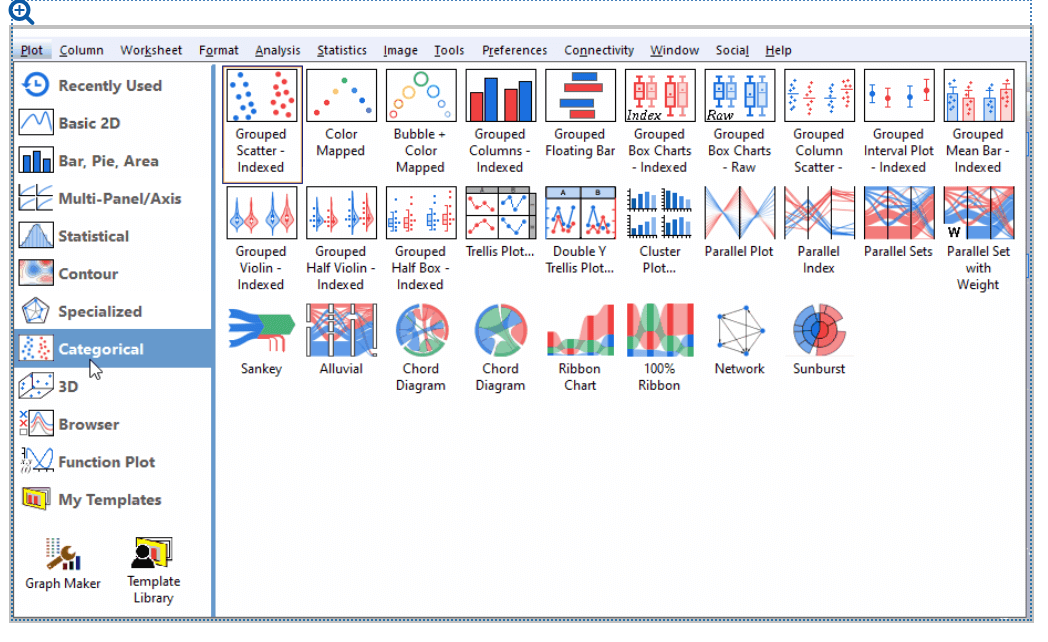
OriginPro es una herramienta científica de gráficos y análisis de datos utilizada por más de medio millón de ingenieros y científicos para crear representaciones visuales de datos sin necesidad de programación.
Por qué elegí OriginPro: Si deseas representar datos visualmente, hay pocas opciones mejores que OriginPro. El software cuenta con más de 100 tipos de gráficos incorporados y permite la personalización de cada elemento mediante selección y clic. Incluso puedes guardar los gráficos personalizados como nuevas plantillas, para no tener que crearlos desde cero en futuros informes.
Características y integraciones destacadas:
Características incluyen una organización de datos intuitiva con una interfaz estilo hoja de cálculo que mantiene tu trabajo ordenado y accesible. Puedes crear fácilmente gráficos de varios paneles para comparar conjuntos de datos uno al lado del otro. El software también ofrece herramientas de procesamiento por lotes para ahorrar tiempo en tareas repetitivas.
Integraciones incluyen MATLAB, Excel, Python, LabVIEW, LabTalk, SQL Server, R, MySQL, Origin C y COM.
Pros and Cons
Pros:
- Excelente análisis gráfico
- Interfaz de usuario intuitiva
- Buen equipo de soporte
Cons:
- El programa ocasionalmente se bloquea
- Sección de ayuda insuficiente
Otro software de análisis estadístico
Estas son algunas opciones adicionales de software de análisis estadístico que no llegaron a mi lista de preseleccionados, pero que aun así merece la pena consultar:
- NCSS
Ideal para la navegación por los resultados
- GraphPad Prism
Mejor para la investigación científica
- SUDAAN
Ideal para analizar estudios complejos


Cómo Evalúo el Software de Análisis Estadístico
Cuando un analista de riesgos necesita ejecutar simulaciones de Monte Carlo o un equipo de FP&A requiere pronósticos basados en ARIMA, primero busco profundidad estadística básica y luego evalúo los diferenciadores que distinguen unas herramientas de otras.
Funcionalidad Básica (Criterios Fundamentales para Esta Lista)
Cuando selecciono herramientas para mi lista, califico cada una en una escala de 0 (no ofrece la funcionalidad) a 5 (sobresale en esta área) para cada funcionalidad básica que se indica a continuación. Después, calculo el puntaje total de la herramienta en forma de porcentaje. Cada herramienta necesita lograr un puntaje total mínimo del 65% para ser considerada para su inclusión.
- Estadística Descriptiva e Inferencial: Verifico si la herramienta cubre toda la gama de pruebas paramétricas y no paramétricas, desde pruebas t básicas para análisis de varianza hasta pruebas de chi-cuadrado para datos de auditoría categóricos.
- Regresión y Modelado Econométrico: Ya sea que esté construyendo un modelo de ingresos multivariante o ajustando un modelo GARCH a datos de volatilidad, evalúo la profundidad y variedad de métodos de regresión disponibles.
- Pronóstico de Series Temporales: Busco capacidades de ARIMA, suavizamiento exponencial y descomposición estacional que permitan a los equipos de FP&A proyectar flujo de caja o modelar tendencias cíclicas en datos financieros.
- Monte Carlo y Simulación: Los analistas de riesgos necesitan realizar pruebas de estrés a portafolios y modelar incertidumbre en proyecciones, así que evalúo cómo cada herramienta maneja simulaciones probabilísticas y análisis de sensibilidad.
- Importación de Datos e Integración Financiera: La herramienta debe conectarse a las fuentes de datos que realmente utilizan los equipos de finanzas, como libros de Excel, bases de datos SQL y plataformas ERP como SAP o NetSuite.
- Informes y Visualización: Busco gráficos estadísticos, formatos de informe exportables y visuales listos para presentaciones que ayuden a traducir resultados para los grupos de interés durante presentaciones al consejo o reuniones de auditoría.
Una vez que tengo una lista de herramientas que cumplen con los criterios, considero qué distingue a cada plataforma.
Factores Diferenciadores (Qué Distingue a los Proveedores)
Así es como comparo y contrasto diferentes proveedores:
Características Destacadas
La creación de modelos sin necesidad de programar es clave: busco interfaces por menú o de arrastrar y soltar que permitan a los analistas de FP&A ejecutar regresiones sin escribir código. Por otro lado, el soporte para scripts en R o Python es importante cuando los equipos cuantitativos necesitan automatizar modelos recurrentes. Para los flujos de trabajo de contabilidad forense, el análisis incorporado de la Ley de Benford y los métodos automatizados de muestreo de auditoría ahorran semanas de trabajo manual. También evalúo los espacios de trabajo colaborativos con control de versiones y seguimiento de auditoría, que resultan esenciales cuando varios analistas contribuyen a la misma revisión financiera.
Más Allá de las Características
La seguridad de los datos es prioritaria cuando se manejan conjuntos de datos financieros, por lo que verifico la certificación SOC 2 Tipo II y los estándares de cifrado antes de avanzar. La integración con el ecosistema tecnológico financiero también es importante: las herramientas que se conectan nativamente a sistemas ERP, plataformas de BI y proveedores de datos de mercado eliminan horas de preparación manual de datos. Además, evalúo la flexibilidad en el despliegue, ya que algunos equipos de finanzas requieren instalaciones locales para cumplir con políticas internas de IT. Finalmente, los recursos de capacitación proporcionados por el proveedor, con ejemplos específicos para finanzas, ayudan a que los equipos sean productivos más rápidamente tras la implementación.
Cómo elegir un software de análisis estadístico
Elegir un software de análisis estadístico puede resultar abrumador rápidamente. Por eso, he creado esta sencilla lista de comprobación para ayudarte a comparar herramientas, identificar las funciones imprescindibles y tomar una decisión con confianza. Úsala para mantener tu búsqueda centrada y eficiente.
| Factor | Qué debes considerar |
|---|---|
| Escalabilidad | Asegúrate de que el software pueda gestionar el crecimiento de tus datos. Busca soluciones que se adapten a tus necesidades sin perder rendimiento. |
| Integraciones | Comprueba si se integra con tus herramientas actuales, como otros programas de contabilidad empresarial, sistemas CRM o ERP, para optimizar los flujos de trabajo. |
| Personalización | Busca un software que te permita adaptar sus funcionalidades a tus requisitos analíticos específicos. |
| Facilidad de uso | Da prioridad a interfaces intuitivas que requieran una formación mínima para que tu equipo pueda utilizarlas de manera eficiente. |
| Presupuesto | Evalúa el coste total, incluidas las tarifas ocultas, para asegurarte de que se ajusta a tus limitaciones financieras. |
| Medidas de seguridad | Verifica que existan medidas sólidas de protección de datos para mantener segura la información confidencial frente a filtraciones. |
| Asistencia | Ten en cuenta la disponibilidad y la calidad del servicio de atención al cliente para resolver rápidamente cualquier problema. |
| Visualización de datos | Asegúrate de que el software ofrezca herramientas sólidas de visualización para interpretar claramente la información obtenida de los datos. |
¿Qué es el software de análisis estadístico?
El software de análisis estadístico es una herramienta que te ayuda a recopilar, interpretar y modelar grandes conjuntos de datos para descubrir patrones y orientar la toma de decisiones. Utilizado por analistas financieros, investigadores y científicos de datos, simplifica los datos complejos mediante la visualización, el modelado predictivo y el análisis de tendencias.
Estas herramientas son esenciales para transformar los datos sin procesar en información práctica, ayudando a las empresas a prever el rendimiento, gestionar el riesgo y mantener su competitividad.
Características
Al elegir un software de análisis estadístico, busca funciones que realmente respalden la obtención de información financiera para tu empresa. Estas pueden incluir análisis de series temporales, modelos de previsión, modelado de riesgos o simulaciones de Monte Carlo. Otras funciones clave que debes buscar incluyen:
- Visualización de datos: Presenta los datos y los resultados del análisis estadístico complejos en un formato comprensible mediante gráficos y diagramas.
- Estadística descriptiva: Proporciona medidas estadísticas básicas, como la media, la varianza y la desviación estándar, para resumir conjuntos de datos.
- Contraste de hipótesis: Permite a los usuarios comprobar supuestos sobre un conjunto de datos, lo cual es fundamental para la investigación científica.
- Análisis de regresión: Ayuda a comprender las relaciones entre variables y a predecir tendencias futuras basándose en datos históricos.
- Importación/exportación de datos: Facilita la importación de datos desde diversas fuentes y la exportación de los resultados del análisis a distintos formatos.
- Informes automatizados: Genera informes avanzados automáticamente, ahorrando tiempo y reduciendo el riesgo de errores humanos.
- Análisis en tiempo real: Permite analizar los datos a medida que se recopilan, lo cual es esencial para la toma de decisiones en situaciones que requieren rapidez.
- Gestión de datos: Proporciona herramientas para organizar, almacenar y recuperar datos de forma eficiente.
- Métodos estadísticos avanzados: Incluye una amplia variedad de técnicas estadísticas potentes para realizar análisis exhaustivos.
- Capacidades de integración: Permite una integración fluida con otras herramientas de software, mejorando la funcionalidad general y la productividad de los usuarios de equipos de cualquier tamaño.
Beneficios
Tanto si eliges SAS como R o Python, el software de análisis estadístico te ofrece una ventaja competitiva en el ámbito financiero. Estos son algunos de los beneficios habituales que puedes esperar del mejor software para análisis estadístico:
- Mayor precisión: Reduce los errores de cálculo, garantizando un análisis de datos y unas conclusiones más precisos.
- Ahorro de tiempo: Automatiza los cálculos complejos, lo que permite procesar y analizar los datos con mayor rapidez.
- Visualización de datos: Crea gráficos y diagramas, facilitando la comprensión y la interpretación de la información obtenida de los datos.
- Mejora de la toma de decisiones: Proporciona un análisis de datos fiable, ayudando a los equipos a tomar decisiones empresariales fundamentadas basadas en métricas de rendimiento corporativo.
- Escalabilidad: Gestiona grandes conjuntos de datos de forma eficiente, permitiendo analizar grandes volúmenes de información sin problemas de rendimiento.
- Coherencia: Estandariza los procesos de análisis de datos, garantizando resultados coherentes en distintos conjuntos de datos y proyectos.
- Analítica avanzada: Ofrece modelos y procedimientos estadísticos complejos, permitiendo obtener información más profunda y realizar análisis predictivos. Esto puede ser extremadamente valioso durante el proceso de cierre y consolidación.
Costes y precios
Sé que elegir un software de análisis estadístico puede resultar confuso rápidamente. Para facilitarte la tarea, he creado una tabla sencilla que muestra los planes de precios habituales, los costes medios y lo que incluye cada uno:
| Tipo de plan | Precio medio | Funciones comunes |
|---|---|---|
| Gratuito | $0 | Herramientas estadísticas básicas, opciones limitadas de importación de datos y asistencia de la comunidad. |
| Personal | $19-$50/user/month | Herramientas estadísticas avanzadas, visualización de datos y asistencia por correo electrónico. |
| Empresarial | $51-$125/user/month | Funciones de colaboración, integración con otros programas y asistencia prioritaria. |
| Corporativo | Precios personalizados | Analítica integral, gestor de cuenta dedicado y funciones de seguridad avanzadas. |
Preguntas frecuentes sobre software de análisis estadístico
Aquí tienes algunas respuestas a preguntas frecuentes sobre el software de análisis estadístico:
¿Qué tipos de gráficos y visualizaciones se pueden producir utilizando software de análisis estadístico?
Los cuatro tipos de gráficos utilizados en el análisis estadístico son los gráficos de barras, líneas, sectores e histogramas. En concreto, el software de análisis estadístico puede ejecutar una amplia variedad de modelos y visualizaciones de datos, incluidos análisis de regresión, gráficos de ejecución, diagramas de Pareto y gráficos de control de variables.
¿Cuál es la diferencia entre el software de análisis estadístico y las herramientas de visualización de datos?
El software de análisis estadístico se centra en procesar e interpretar datos para descubrir tendencias y patrones, mientras que las herramientas de visualización de datos se centran en presentar los datos en un formato visual. Si necesitas realizar cálculos complejos y pruebas estadísticas, querrás utilizar un software de análisis estadístico. Sin embargo, si tu objetivo es crear gráficos o diagramas, una herramienta de visualización puede ser suficiente.
¿Puede el software de análisis estadístico gestionar grandes conjuntos de datos?
Sí, la mayoría de los programas de análisis estadístico pueden gestionar grandes conjuntos de datos. Sin embargo, la capacidad de procesar grandes volúmenes de datos de manera eficiente depende de la arquitectura del software y de los recursos de tu sistema. Consulta las especificaciones del software para conocer los límites de tamaño de los datos y asegúrate de que tu hardware cumpla los requisitos recomendados para evitar un rendimiento lento.
¿Necesito conocimientos técnicos para utilizar un software de análisis estadístico?
No necesariamente. Aunque algunos programas requieren un sólido conocimiento de estadística, muchas herramientas modernas ofrecen interfaces fáciles de usar y tutoriales para ayudar a los principiantes. Si eres nuevo en el análisis estadístico, busca un software con recursos de asistencia completos, como vídeos de formación y preguntas frecuentes, para facilitar la curva de aprendizaje.
Qué sigue:
Si estás investigando software de análisis estadístico, conecta gratuitamente con un asesor de SoftwareSelect para recibir recomendaciones.
Rellenas un formulario y mantienes una breve conversación en la que conocerán los detalles específicos de tus necesidades. Después recibirás una lista de los programas más adecuados para revisar. Incluso te apoyarán durante todo el proceso de compra, incluidas las negociaciones de precios.