How To Write A Financial Analysis Report: Complete Guide


All About the Data: Financial analysis reports tell stakeholders everything they need to know about your company's financial health. They include an executive summary, overview, financial analysis details, and recommendations.
The Types of Analysis: When preparing your financial analysis report, include everything from trend and SWOT analysis, to market and economic analyses.
Lean on Reliability: Always make sure your data is reliable. Incorrect data can skew results and impact your company more than you know.
Financial analysis reports are essential tools for demonstrating to investors why your company is a worthwhile investment. While their primary purpose often focuses on attracting investor interest, these reports also serve a broader role by providing stakeholders with detailed financial insights.
However, failing to create a valuable financial analysis report can lead to several downfalls. Without a clear and comprehensive report, your company may struggle to attract investors or secure necessary funding. Additionally, inadequate financial analysis may result in poor decision-making, as critical data needed to identify trends, risks, and opportunities may be overlooked.
As a former accountant with years of experience analyzing and interpreting financial data, I understand the importance of creating a well-rounded financial analysis report—which is why I created this article. Here’s my detailed breakdown of financial analysis reports, from what’s included, who’s involved, and how to prepare one. So, let’s dive in.
What is a Financial Analysis Report?
A financial analysis report gives stakeholders a comprehensive view of your company’s financial health and performance. It’s the go-to document for management, investors, and creditors to make data-backed decisions regarding investments, lending, and more.
Financial analysis reports can vary in extensiveness based on various factors, like the objective of creating the report and the intended users of the report, among other things. For example, I used to make financial analysis reports for investors external to the company. This means I didn’t include any recommendations for improving the company’s financial performance.
When creating a report for internal analysis, this is a critical section in the report that gives stakeholders recommendations on ways to solve problems brought to light in the financial analysis report.
What’s Included in a Financial Analysis Report
The components of a financial analysis report vary based on the purpose of the report, but let’s walk through a few components you’ll generally need to include in your report.
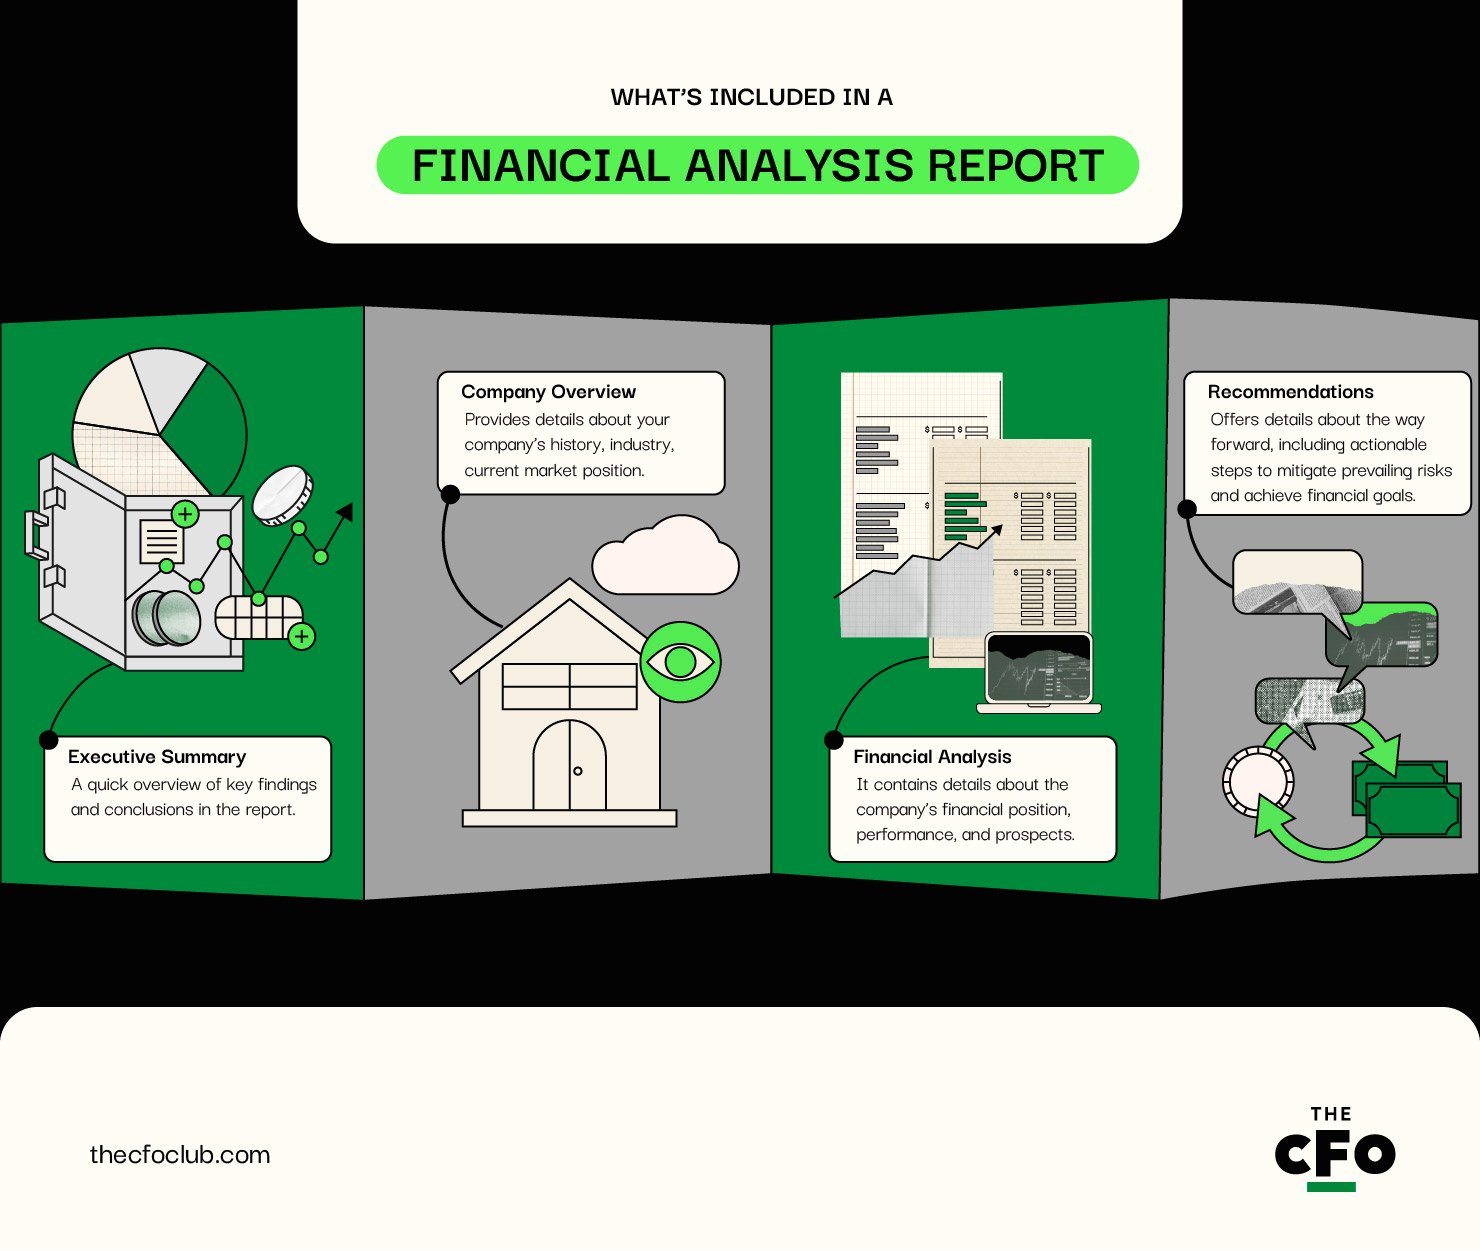
Broadly, there are four sections in a financial analysis report:
- Executive Summary: A quick overview of key findings and conclusions in the report.
- Company Overview: Provides details about your company’s history, industry, current market position, and more.
- Financial Analysis: The largest section in the report. It contains details about the company’s financial position, performance, and prospects.
- Recommendations: Offers details about the way forward, including actionable steps to mitigate prevailing risks and achieve financial goals.
Who’s Involved in Preparing a Financial Report Analysis?
Every company has the freedom to choose who prepares the financial report analysis—no hard rules there. Instead, let’s talk about the options you have available when choosing people to be involved in the report’s preparation. I like to divide the options into two categories:

Internal Stakeholders
These are people who know your company from within and can provide hands-on insights. Here are your options when choosing from internal stakeholders:
- Financial Analysts: Financial analysts are professionals who specialize in financial analysis—things like projecting cash flows, identifying financial patterns, and analyzing the company’s cost and capital structure.
- Accountants: Accountants prepare the company’s financial statements. Since these statements are foundational to your analysis, involving them can be beneficial.
- CFO: The CFO oversees your company’s financial reporting process and compliance. They help the company achieve its financial goals with smart, data-driven decision-making. Bringing your CFO on board is a great way to add foresight to your report.
- Internal Auditors: Internal auditors play a big role in ensuring the accuracy of financial data. They can contribute valuable insights into prevailing risks and mitigation strategies regarding the company’s internal financial processes.
External Stakeholders
- External Auditors: Independent auditors can help reaffirm the claims you’ve made in the report regarding the accuracy of financial data. They can also assess internal controls and confirm their effectiveness.
- Consultants: Consultants are a great resource to add value with their wealth of external data, such as industry data, demographic data, and customer preferences. They can also share their own opinion on your analysis.
- Legal Advisors: Legal advisors can underpin your arguments from a legal standpoint. They can provide assurance that your strategy to achieve your financial goals and minimize risks is possible while complying with regulations. They can even provide insights on existing compliance issues, ways to fix them, and the financial impact of non-compliance.
How to Prepare a Financial Analysis Report
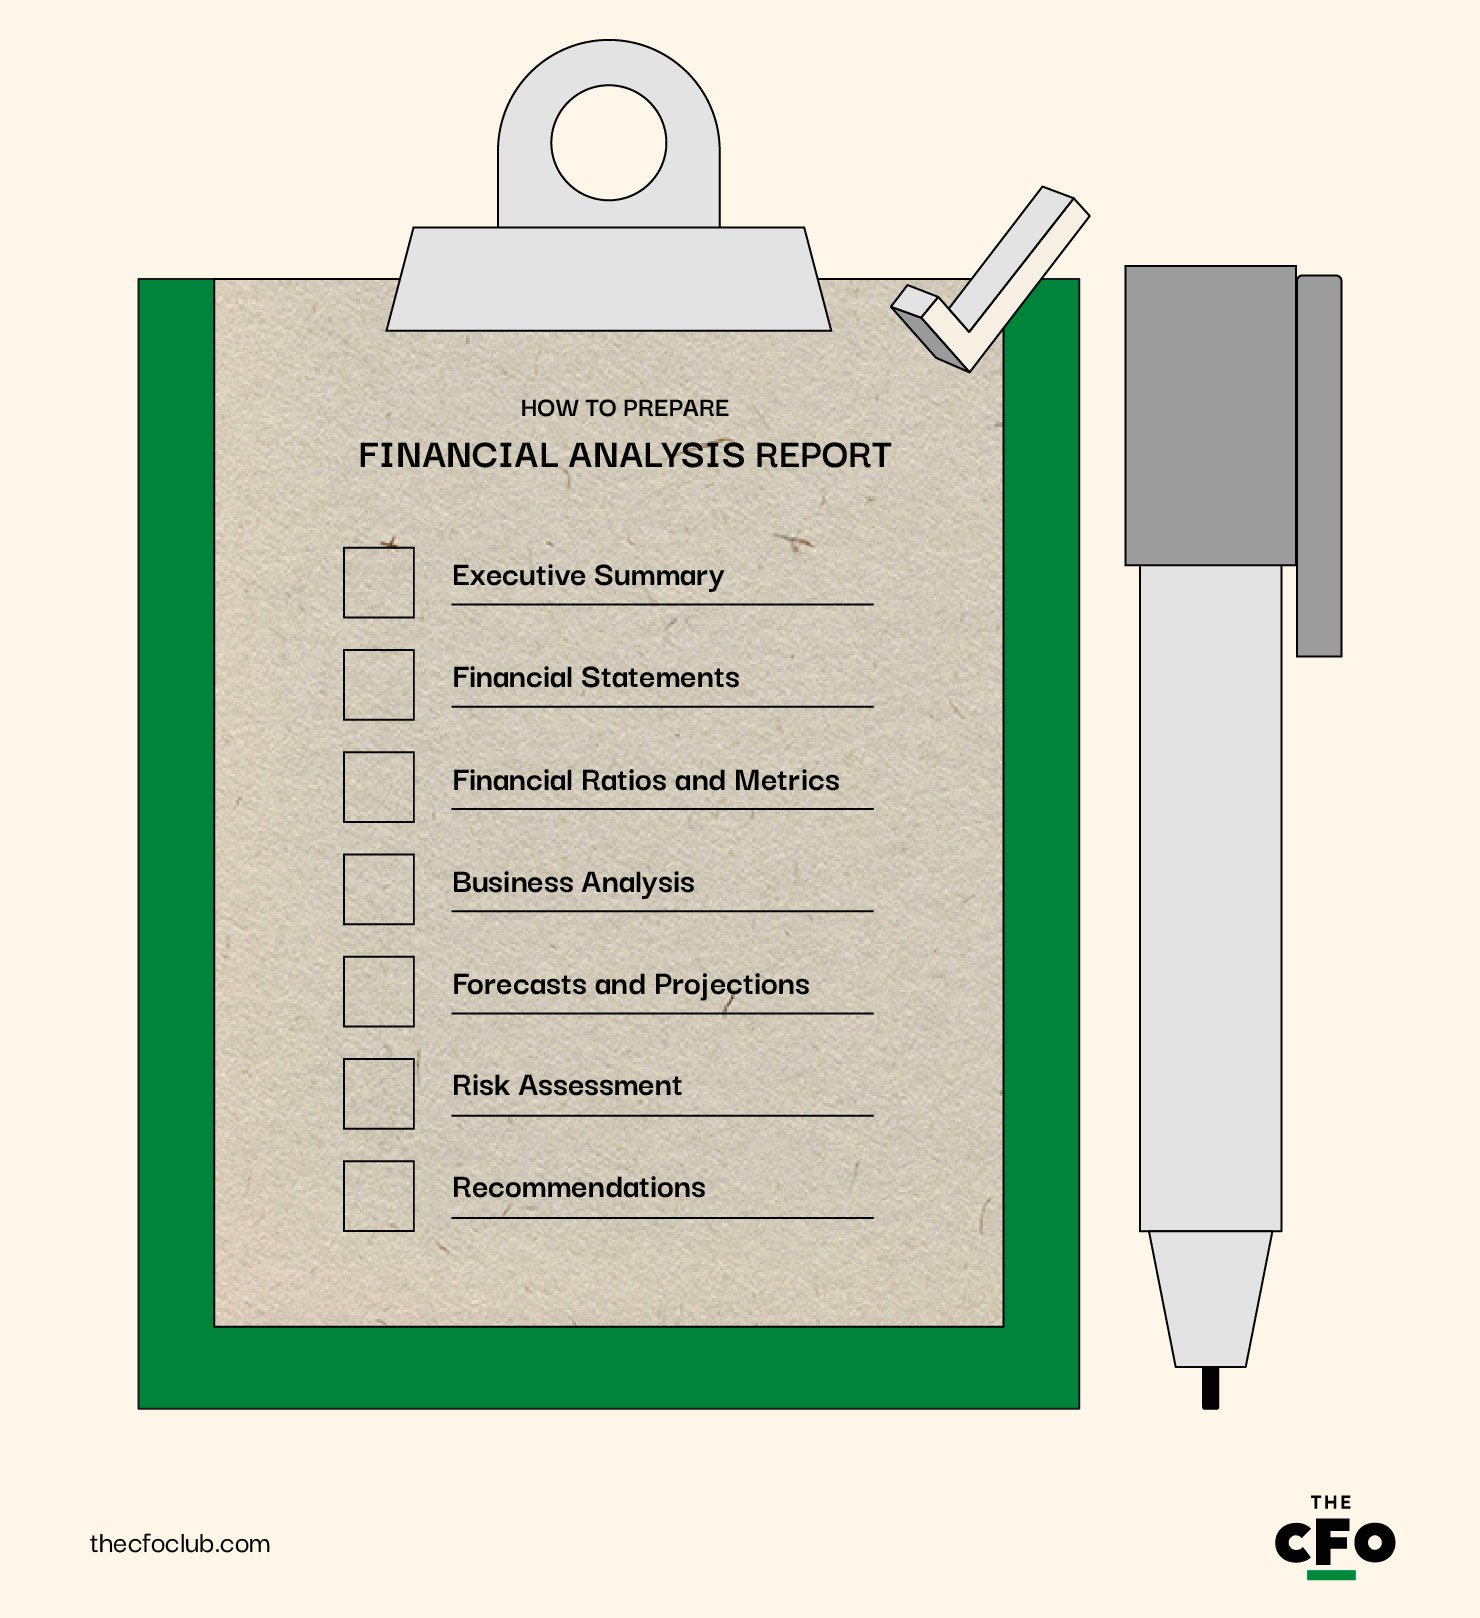
A financial analysis report includes various elements—however, what you include in your reports depends on factors like the purpose of the report and the intended audience. Let’s discuss what each element of the financial analysis report entails and how to prepare it.
Executive Summary
An executive summary is exactly what it sounds like. It’s a summary of important details from the report. While the executive summary should be placed at the beginning of the report, you must prepare it after the rest of the report so you have a complete understanding of what’s in the report.
When writing the executive summary, start with the objective and scope of the report. Mention the period of time covered and the areas of focus in the report.
Then add a company overview—a brief description of the company, including its industry, market position, key products, and recent developments. Skip this section if you’re preparing the report solely for internal stakeholders who already know your company well.
Don’t forget to mention important details in the executive summary, such as key financial metrics and ratios. Use bullet points, charts, and graphs where possible to make it easier to communicate data points. At the end of this section, make sure to summarize major findings, such as findings from SWOT analysis, as well.

Financial Statements
This is where your accountant takes over. This section includes the four key financial statements:
All these statements should be added to this section, along with notes to accounts. Most companies prepare quarterly financial statements, and you can just add those here. At the end of the financial statements, add a summary of key findings and takeaways from the financial statement.
Financial Ratios and Metrics
This is where you dive deep into the financial data that’s available in the financial statements. There are plenty of ratios and metrics out there, so it’s important to select ones that are relevant and important for the users of the financial analysis report. Here are some examples of ratios you can include for ratio analysis:
- Profitability Ratios: Gross profit margin, operating profit margin, return on company assets, and return on equity.
- Liquidity Ratios: Current ratio and quick ratio.
- Leverage Ratios: Debt-to-equity ratio and interest coverage ratio.
- Efficiency Ratios: Inventory turnover, accounts receivable turnover, and total current asset turnover ratio.
- Market Ratios: Earnings per share and dividend yield.
When you include these ratios, also add an interpretation of what those ratios indicate.
For example, suppose your current debt-to-equity (D/E) ratio is 3. This means you have debt triple that of equity on your balance sheet. You expect the economy to slow down and cash flows to become tighter six months to one year from now.
In your financial analysis report, you’d then provide this context and mention that the D/E ratio is currently high. As such, it would be beneficial to reduce financial leverage over the next year and bring the D/E ratio down to 1.5 or lower. This will ultimately help strengthen your balance sheet and lower the weight of interest expense on your income statement.
Of course, this example also brings up various other questions—should you raise fresh equity capital to pay off debt or use current cash? Provide a recommendation on what the best option would be based on inputs from internal and external experts.
Business Analysis (Trend, Comparative, SWOT, Market, and Economic Analysis)
This is the most important section of your financial analysis report. When creating it, try to dive deep into various aspects of business to analyze and interpret the current status of the driving forces behind your company’s financial success. Here’s an overview of things to include:
- Trend Analysis: Identify and analyze prevailing trends in the company’s financial data. This could include trends in revenue, operating expenses, total liabilities, profitability, cash flows, and more.
- Comparative Analysis: Comparative analysis involves analyzing your data by comparing it with industry benchmarks and peer companies.
- SWOT Analysis: Identify your company’s strengths, weaknesses, opportunities, and threats. Use analysis from previous periods to see what progress you’ve made. For example, analyze how your strategy to mitigate threats has worked over the reporting period.
- Market Analysis: Assess the current market size and growth, market trends, competitive landscape, and customer segments. These details help you set realistic goals and determine the best way to achieve them.
- Economic Analysis: Discuss all the macroeconomic factors that impact your industry, new or potential changes in the regulatory environment, and industry-specific economic changes such as commodity prices.
Here’s another example. Suppose you’re a SaaS company. Your financial statement analysis reveals a few trends that you’d like to report. This is how this trend analysis might look like in your report:
“Annual recurring revenue (ARR) grew by 15% year-on-year while the net margin grew by 10%. The difference in growth between the top-line and net income is attributable to the increasing interest expense. Given that we expect accelerating growth over the next few quarters, we believe the rising interest expense shouldn’t cause problems for either cash flow or profitability.”
Forecasts and Projections
This section exclusively focuses on spreadsheets that project all financial figures into the future. During this step, you’ll prepare a projected income statement, balance sheet, and cash flow statement, along with a rationale for the assumptions you’ve used to project these figures.
For example, if you've assumed a 10% year-on-year growth rate, you need a good argument to support that assumption through detailed variance reporting. Projecting financial statements is a plain vanilla way to forecast your financial future. But there are various other use cases to consider:
- Projecting Financial Ratios: You can project financial ratios into the future to understand the future liquidity, solvency, and profitability of the company. It can also be instrumental in determining whether you’ll still be compliant with debt covenants. For example, if a creditor requires you to maintain a D/E ratio of less than 1, knowing beforehand about a potential increase in debt can help you take a more strategic approach.
- Scenario Analysis: Scenario analysis can help stakeholders understand how the financial position will change for one or more business decisions. For example, if you’re a conglomerate about to wind up one of your businesses, sensitivity analysis can help you assess its financial impact under various scenarios. You can also run a sensitivity analysis if you want to assess the sensitivity of specific figures in various scenarios.
- Capital Budgets: Capital budgets are essentially a discounted cash flow valuation of an asset. It helps you understand whether the value of future cash flows that the asset will generate for the business is greater or lower than the current value of the cash outflow needed to acquire and set up the asset.
There are various other tools and techniques that can help you forecast financial figures. However, make sure you’re using accurate numbers and reasonable assumptions. It’s easy to make mistakes or get carried away by bias during analysis.
Take this scenario. Let’s say you want to acquire a machine that costs $100,000. Your discounted cash flow (DCF) model tells you that the net present value (NPV) of this asset, assuming a 5-year life, $25,000 per year cash inflow, and a 5% discount rate, is $108,236. Since the NPV is positive, you can go ahead and make that investment.
Presenting your analysis with concrete numbers and well-reasoned assumptions is important to making your report look credible and sincere.
Risk Assessment
Your business needs to plan for many risks, like operational risks, financial risks, strategic risks, and compliance risks. All of these risks also have financial implications if they play out.
Your financial analysis should discuss key risks that can potentially impact your business and value their financial impact. Along with details about the risk, you must also include the preventive measures and contingency plans you’ve formulated to tackle those risks.
Risk assessment does require some leg work. You’ll need to collect internal as well as external data and brainstorm potential risks, their impact, and preventive measures. This can be a time-consuming process, but access to the right tools can make your job easier.
In this made-up scene, you rely on a limited number of suppliers for key raw materials. Disruption in this supply chain could have a significant impact on your production capabilities and cost structure, and while the likelihood of a disruption is moderate, the impact is high. Suppose that a disruption could lead to five days of idle time, which translates to a loss of $25,000.
You mention these details in the financial analysis report, as well as the steps you’ve taken to minimize those risks. Mitigation strategies may include diversification of suppliers, maintaining a higher level of safety stock, or negotiating more flexible contractual agreements.
Recommendations
Often, you need management, investors, and other stakeholders to take corrective or preventive measures. These suggestions go in the recommendations section. The recommendations should include complete details, including:
- A summary of key findings
- Actionable steps
- The justification for taking such steps
- The expected impact of taking and not taking the recommended steps
- The prioritization of each recommendation and the timeline for implementing them
- Resources required
Here’s a final example. Assume that your company has a D/E ratio of 3. You’ve noticed that your net profit margin has shrunk over the past few quarters because of the increasing interest expense. You suggest that steps should be taken to pay off some debt and refinance corporate bonds with a bank loan with a lower interest rate.
Along with this recommendation:
- Provide details to justify
- Quantify the effect of inaction by calculating the loss the company would incur because of shrinking margins
- State a timeline and the priority for paying off and refinancing the debt
- Explain the resources required (in this case, the cash on your balance sheet)
When To Prepare a Financial Analysis Report
There are no hard rules on the frequency of preparing a financial analysis report. Here are some examples of when you might consider a financial analysis report:
- End of the Financial Period: You may choose to prepare a financial analysis report at the end of each quarter or year.
- Budgeting or Strategic Planning: Financial analysis reports provide insightful data when preparing budgets or during strategic planning.
- Investment Decisions: If you’re about to acquire or merge with another company or invest in a capital asset, a financial analysis report can be instrumental in making smart decisions and keeping all stakeholders informed.
- Raising Capital: Potential lenders and investors might appreciate a financial analysis report when you’re about to raise debt or equity capital.
Tools to Help with Report-Building
There are many tools on the market that help with report-building. It doesn’t make sense to invest in all of these tools, especially if you have no other use for them right now. That said, here are your options:
- Accounting Software: Accounting software can help you prepare the financial statements portion of the report as well as get an overview of available resources, including cash and inventory. SAP ERP and NetSuite are great accounting (and ERP) tools. Read our guide on choosing an accounting solution if you need some assistance.
- Financial Analysis Software: Financial analysis software offers real-time financial data and helps you visualize financial information, which helps derive insightful bits of information. QuickBooks, Sage Intacct, and Xero are great examples.
- Data Aggregation Tools: These tools help you collect and consolidate data from multiple sources. They can be especially helpful when working on the business analysis section of the report. Alteryx and Domo are excellent data aggregation tools.
- Data Visualization Tools: Tools like Tableau and Power BI help you visualize data that enables in-depth data analysis.
- Business Intelligence Platforms: Business intelligence platforms offer advanced analytics and reporting features. These tools combine the functionalities of multiple types of software, including data visualization and financial analysis tools. SAP BusinessObjects, IBM Cognos Analytics, and Oracle BI are some of the top business intelligence tools on the market.
Analysis is Subjective
Two experts might come up with different conclusions based on the same data. Analysis is subjective, so remember, the stakeholders may or may not agree with your analysis, and that’s fine. This is exactly why bringing in experts is important—they can help eliminate biases and add a broader perspective to your analysis.
Want more such insights? Subscribe to our free newsletter to receive weekly insights from leaders and experts shaping the future of finance.

