Van Westendorp Pricing Model: Why It Works + How to Use It

Ever visit wish.com? Did you see the ads for $5 “AirPods” and $99 “Xboxes?” Did their low low price give you low low confidence? Alternatively, have you ever heard of Juicero, the $400 juicer? What do you think, any interest in buying it?
Regardless of your product type, understanding the appropriate pricing band for your offering is a critical component of marketing success. That’s where the Van Westendorp Price Sensitivity Meter comes in. In just four questions, Van Westendorp can give you a range of insights into ideal product pricing, even when you don’t have a lot of data to work with (which makes it extremely valuable for finance leaders in firms in the growth stage).
In this article, I’ll discuss the ins and outs of this model, take a quick look at the benefits and pitfalls, and share some thoughts on when to actually use this pricing tool.
The Van Westendorp Price Sensitivity Model
Dutch economist Peter Van Westendorp developed his namesake pricing model in the 1970s to help marketing, sales, and product teams arrive at ideal pricing for their offerings. By asking survey respondents four pricing questions, Van Westendorp gives researchers a series of graph that reveals respondent perspectives on a number of different price points. The intersection of each of these points provides specific pricing implications, useful for launching or pivoting products and performing ongoing enterprise performance management activities.
Why Use Van Westendorp’s Model?
At its core, Van Westendorp represents an easy-to-use, relatively quick way to get pricing perspectives directly from your customers. It also provides the opportunity to scope down into discrete cohorts of your customer base, by demographic or other characteristics. Finally, by asking a series of questions that paint a clear picture of pricing without just asking what your respondents think is a “good price”, you’ll get a more accurate, less fluffy response.
When to Use the Model
There are a few specific situations where Van Westendorp makes the most sense. Like Gross Revenue Retention, a metric I covered in my last CFO Club article, this model is specifically relevant to SaaS businesses. However, Van Westendorp is also applicable to a range of other firms as well. In general, it makes sense mostly for B2B selling scenarios, since these buyers tend to have a greater awareness of pricing than consumer buyers.
Here are a few scenarios in which this model proves extremely useful:
New Product Launch
If you’re launching a completely new product, Van Westendorp will deliver a lot of value by giving you some pricing clarity without needing to rely on existing sales data.
Product Changes
Similarly, if you’re making major changes to an existing product, like repositioning it in the market, adding new features, or even reducing your service offering, deploying one of these analyses will help you understand how price-sensitive your customers are.

Raising Prices
If you’re considering raising prices or switching to a new pricing model, such as usage-based pricing, running a Van Westendorp survey will help you understand how far you can push it before it goes over the edge.

Van Westendorp Surveys
The Van Westendorp methodology is simple. First, researchers ask respondents four questions. The respondents might be members of a mailing list, participants identified by a market research firm, existing customers, or other types of participants.
In an ideal world, each question is presented as a slider or multiple choice entry, allowing you to set a minimum and maximum range, avoiding the blank option of a “fill in the blank” question. Asking participants to write their own answers can be misleading due to respondents giving lowball answers or coming in with a completely irrelevant pricing context in mind.
Survey tools offering sliders as a type of question include SurveyMonkey, Conjointly (which also offers a Van Westendorp Excel template), and Qualtrics.
The Four Survey Questions
When you go to create your survey, these are the questions to ask:
- What price point is too expensive for you to consider a purchase?
- What price point is so cheap you’d question the quality of the offering?
- What price point represents a bargain?
- What price point is expensive but still an option?
For the rest of this article, I’ll refer to each of these questions as Too Expensive (#1), Too Cheap (#2), Bargain (#3), and Expensive (#4).
After collecting responses, you’ll organize them in a spreadsheet, with the X-axis representing your questions and the Y-axis representing your respondents; you’ll fill each corresponding cell in with a specific respondent’s answer to a specific pricing question.
Your next step will be to summarize the responses to each question on a cumulative basis. For instance, 25% of respondents might say that $100 is too high for your product, 50% might say $150 is too high, 75% might say $175 is too high, and so on.
Main Takeaways from Van Westendorp
By collecting a large number of responses, your four survey questions will provide you with actionable pricing insights and a range of acceptable prices via the Price Sensitivity Meter. You’ll also come away ready to complete additional analyses relating to revenues and price elasticity.
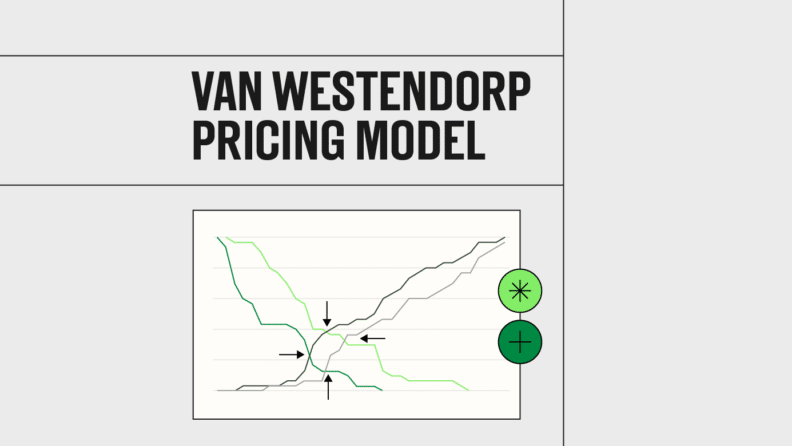
Price Sensitivity Meter (PSM)
Where Too Cheap and Bargain Intersect: The Point of Marginal Cheapness (PMC)
At this point, you’re flirting with Too Cheap. Anything below this point would probably be too low of a price for most of your customers to feel confident in what you’re offering.
Where Too Expensive and Bargain Intersect: The Point of Marginal Expensiveness (PME)
Like the PMC, this point indicates a possible upper bound for ideal pricing, before which your product’s value doesn’t satisfy its cost.
The Acceptable Price Range
Between the two marginal points is the acceptable price range, an area of pricing that is exactly what it sounds like. This is the core area you should be looking at when deciding on pricing. Within this range, you’ll find your actual ideal pricing, a figure that takes many other business considerations beyond just your Van Westendorp results into consideration.
Where Too Expensive and Too Cheap Intersect: The Optimal Price Point (OPP)
This is the single point at which Van Westendorp says you’ll experience the least price hesitation from customers. It is not necessarily the same as the optimal price point for maximizing revenue.
Where Expensive and Bargain Intersect: The Indifference Price Point (IPP)
At this point, equal proportions of respondents say that your product is a bargain and that it is expensive but still worth considering. If your survey respondents are in your target demographic, IPP indicates a relative indifference to your pricing at this level. If your respondents aren’t in your target demographic, IPP shows you that you should return to the drawing board to find better candidates for your survey.
Price Elasticity Chart
Elasticity is a measure of how responsive one variable is to a change in another, such as how demand relates to changes in price. A Van Westendorp analysis does not directly provide this information, but with the Newton, Miller, and Smith extension, you can arrive at a rough estimate.
Under the Newton, Miller, and Smith extension, participants are asked follow-up questions about how likely they are to make a purchase at the Bargain and Expensive points. From there, you’re able to estimate how demand increases or decreases as the price goes up or down.
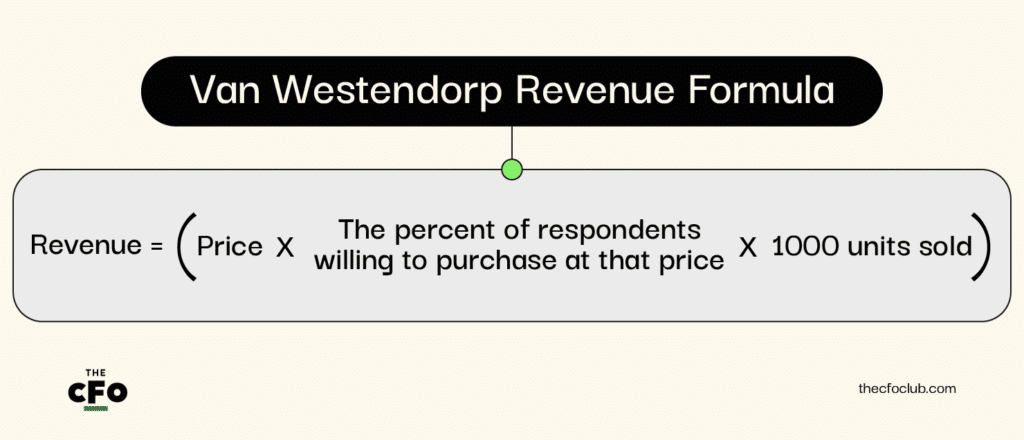
Revenue vs Price Chart
Similar to elasticity, Van Westendorp doesn’t directly imply an ideal price point to maximize revenue. However, using the same Newton, Miller, and Smith extension that layers demand data, you’ll be able to get an approximate understanding of how to price your product in order to maximize revenue. The formula is simple:
Using Customers to Determine Your Perfect Price
The Van Westendorp analysis is but one of several pricing tools that aim to understand how much your customers are willing to pay and how sensitive they are to changes in price or product. Other analytical tools include monadic testing, where different groups of respondents are asked a pricing question about just one product, and then their group responses are compared, and conjoint analysis, which aims to understand how respondents value particular product features in your offering.
This kind of research is just one part of an effective pricing research process. To gain a comprehensive picture of consumer perceptions and consequently optimal pricing, you’ll also want to carefully consider your product’s costs, economic factors, and the pricing strategies used by your competitors. Armed with that information, you’ll be able to determine the ideal pricing strategy for your product.
Limitations of the Van Westendorp Pricing Model
Some of the biggest Van Westendorp limitations relate to the questions it asks and the way it asks them.
No Insight into Demand
As mentioned above, the Van Westendorp Price Sensitivity Meter only addresses pricing and does not speak to demand for your product. If the insights from Van Westendorp are misapplied, you could end up setting pricing at a point that is completely out of touch with your competitive landscape.
Garbage In, Garbage Out
If your survey respondents are not representative of your actual target market, you’ll get subpar, inaccurate results. If your survey is presented in a manner that is confusing or unclear, you’ll get subpar, inaccurate results. If the way you describe your product in the survey is not honed to a T, you’ll get subpar, inaccurate results.
Making matters harder, you may not even realize that you’re hitting any of these stumbling blocks. Perhaps your understanding of your target market is off. Maybe the way you describe your product works for your own team and the friends you’ve been bouncing ideas off of for the last year and a half, but does little to educate your actual user base. Or potentially, you have your product description down pat but it isn’t translating into your survey language.
It’s worth paying close attention to these challenges while running through your Van Westendorp exercise. If you find results that seem off the mark based on your other market research, consider analyzing whether you’ve gone off track at some point in the survey process.
Wrapping it Up
While the Van Westendorp tool has a reputation for being fairly straightforward to deploy, it’s important to remember that its effectiveness comes down to how well you plan and execute your survey. If you don’t understand your target market or fail to properly explain your product while asking respondents to share pricing perspectives, you might wind up with the latest multi-hundred dollar juice machine.
If this article was helpful, be sure to subscribe to The CFO Club newsletter to receive more info like it, directly in your inbox.
