Balance Sheet Forecasting: Complete Guide + Examples


Forecasting Crystal Ball: Balance sheet forecasting offers CFOs a predictive view of assets, liabilities, and equity, enabling informed budgeting and planning for future financial health.
Dynamic Data: Using Excel's dynamic formulas and functions, such as VLOOKUP and INDEX, enhances the flexibility and accuracy of balance sheet forecasts, allowing for easy updates and consistent checks.
No Jumps, Please: Identifying big events like funding rounds and acquisitions in forecasts helps clarify their cash flow impacts and ensures balance sheets align with actual financial activities.
Balancing, Beware: While forecasts support strategic decisions and risk mitigation, they require assumptions that can lead to inaccuracies, and need time and expertise to maintain.
Balance sheet forecasting isn't exactly the topic that gets most CFOs jumping out of bed in the morning. Yet here you are, coffee in hand, trying to make sense of how to project your company's financial position months or even years into the future.
Whether you're leading finance at a new startup or managing the books at a multinational enterprise, forecasting your balance sheet often feels frustratingly complex.
But here's the good news: balance sheet forecasting doesn't have to be a nightmare of spreadsheets and assumptions. With the right methods, practical examples, and some Excel wizardry, you can transform this necessary evil into one of your most valuable strategic tools.
What Is Balance Sheet Forecasting?
Balance sheet forecasting helps you budget and plan your finances. It predicts your future assets, liabilities, and equity. This tool is like a crystal ball for CFOs, showing your company's future financial health for stakeholders and investors.
When you create a forecast, you’re predicting:
- The assets your company will own (cash, inventory, equipment, etc.)
- The amounts you owe to others (accounts payable, loans, etc.)
- The equity left for the owners
Balance sheet forecasting is more than just a checkbox in the 3-statement model; it’s a strategic lever. When the balance sheet, income statement, and cash flow are tightly linked, even small shifts can reveal meaningful trends. This integrated view isn’t just informative; it’s how forward-looking decisions get real financial grounding.
Why Is Balance Sheet Forecasting Important?
Balance sheet forecasts pull from a mix of historical, strategic growth assumptions, and broader market signals.
You’re likely already layering in macroeconomic factors, capital structure shifts, and investment planning, because that’s where the forward picture starts to get real. When done right, this type of modeling surfaces strategic insights beyond the surface-level figures.
Most CFOs begin with working capital since it’s a natural proxy for short-term resilience. But the real value of balance sheet forecasting kicks in when it becomes a lens for scenario planning, funding needs, and board-level decision support:
- Strategic Decision-Making: These financial forecasts help assess the financial impact of decisions, such as new investments or acquisitions.
- Capital Management: They assist in finding the best mix of debt and equity, evaluating capital needs, and planning future investments.
- Regulatory Compliance: Forecasting helps ensure you meet reporting requirements and makes the financial reporting process smoother.
Analyzing the balance sheet is crucial because it provides a snapshot of a company’s financial health at a specific time. It shows a company’s ability to survive hard times and grow for a long time.
Building a High-Impact Balance Sheet Forecast
Before diving into the mechanics of forecasting in Excel, it’s worth pausing to make sure the fundamentals are aligned. Let’s quickly revisit the key accounting levers—not for a refresher, but to frame how each one feeds directly into the structure and integrity of your balance sheet forecast.
1. Roll Forward Balances
Rolling forward prior-period balances is more than just step one; it's what gives the balance sheet its forecasting integrity. Since the balance sheet is inherently cumulative, a strong roll-forward lets you track how movements in specific accounts flow through to working capital and ultimately shape your cash position.
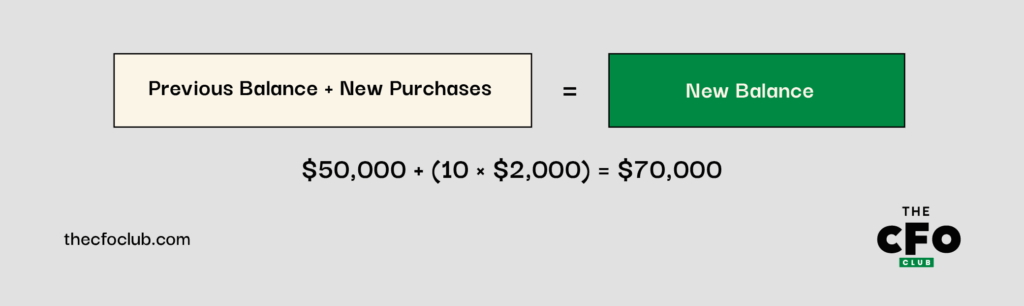
Take something as basic as asset expansion. Say your existing balance in “employee equipment” sits at $50K, and you're onboarding 10 new team members who’ll each need a $2K laptop. The math is simple, but the implications on CapEx, cash burn, and asset aging are worth paying attention to:
This same logic applies to PP&E, intangibles, and their associated depreciation and amortization schedules:
| Account | Formula |
| PP&E | Beginning PP&E + Capital Expenditures - Disposals = Ending PP&E |
| Intangible Assets | Beginning Intangible Assets + New Acquisitions - Write-offs = Ending Intangible Assets |
Keeping these flows visible lets you test sensitivities with more precision and tie asset movements back to actual business planning.
When you're forecasting one-off capital spends, like a new office fit-out or lab equipment, isolate them as discrete line items in the model. This helps tidy the assumptions while also giving you clearer visibility into timing and impact.
-

Creatio CRM
Visit WebsiteThis is an aggregated rating for this tool including ratings from Crozdesk users and ratings from other sites.4.7 -
LiveFlow
Visit WebsiteThis is an aggregated rating for this tool including ratings from Crozdesk users and ratings from other sites.4.9 -
Float Financial
Visit WebsiteThis is an aggregated rating for this tool including ratings from Crozdesk users and ratings from other sites.4.2


2. Determine Net Zero Accounts
Not every account earns its keep by being rolled forward. For certain volatile items, like accounts payable or accrued expenses, it often makes more sense to forecast from net zero.
The goal here isn’t precision for precision’s sake; it’s to avoid false stability in accounts that are anything but stable.
This is where a quick flux analysis comes into play. If an account swings materially from period to period, anchoring it to an operational driver (like COGS or revenue) gives you a more grounded projection.
For example:
| Account | Forecast Method | Calculation |
| Accounts Payable | % of COGS | $500,000 (COGS) × 7.3% = $36,500 |
| Accrued Expenses | % of Revenue | $1,000,000 (Revenue) × 5.2% = $52,000 |
This approach allows you to tie these accounts to your operational forecasts rather than assuming they'll follow historical patterns.
3. Focus on Net Working Capital Accounts
Working capital is where the balance sheet forecast can either sharpen your visibility, or cloud it. AR, AP, inventory, and deferred revenue don’t just move independently; they ripple through liquidity, cash planning, and working capital efficiency.
This is where forecasting tends to get fuzzy.
Deferred revenue timing, collection lag, and inventory turns rarely behave in averages. Instead of smoothing them out, link your revenue, billing cadence, and collections strategy as tightly as possible to the model. The closer your forecast mirrors the actual operational rhythm, the more useful it becomes.
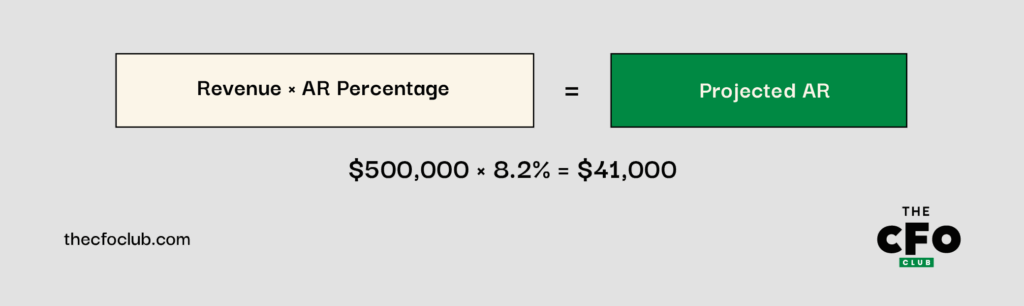
For example, if your accounts receivable typically represent 8.2% of your revenue and you're forecasting $500,000 in revenue, your accounts receivable projection would be:
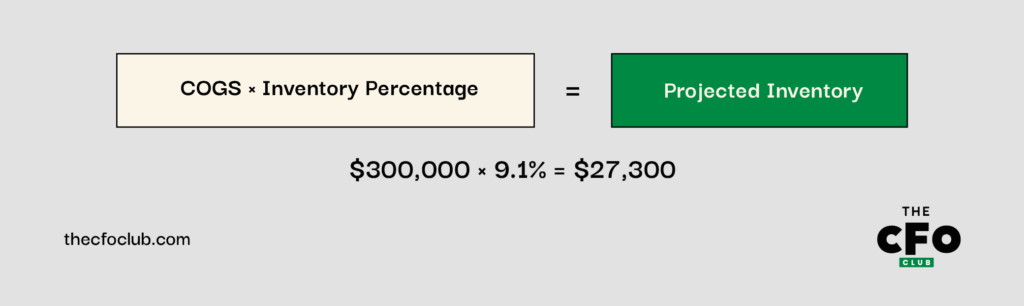
Similarly, if inventories typically represent 9.1% of your cost of goods sold, and you're forecasting $300,000 in COGS, your inventory projection would be:
4. Create Events for Major Impacts to Cash
Even the cleanest balance sheet forecast will fall short if it glosses over the big, lumpy events. Think:
- Funding rounds
- Major CapEx
- Acquisitions
- Scheduled debt repayments
These aren’t just cash blips; they move through non-current assets and liabilities, from goodwill and PP&E to long-term debt and deferred tax. Carving out discrete events in your model lets you isolate their effects and stress-test your capital structure with more clarity.
For example:
| Event | Date | Account Affected | Amount | Impact on Balance Sheet |
| Term Loan | June 2025 | Long-Term Debt | +$500,000 | Increases Cash Assets and Long-Term Liabilities |
| Equipment Purchase | August 2025 | PP&E | -$200,000 | Decreases Cash, Increases PP&E |
| Debt Repayment | December 2025 | Long-Term Debt | -$50,000 | Decreases Cash and Long-Term Liabilities |
By incorporating these events into your forecast, you gain visibility into how they'll affect your cash balance and overall financial position.
5. Build Out Other Equities
This is where your model tells the story of ownership value, and how it’s evolving. You're not just plugging in historical structures; you're projecting the implications of capital decisions. So as you build this section out, make sure to reflect:
- Common stock
- Additional paid-in capital (APIC)
- Treasury stock
- Retained earnings
You’ll find these sitting below the line in the equity section of the balance sheet. Just to anchor the forecast, here’s a quick refresher on the retained earnings:
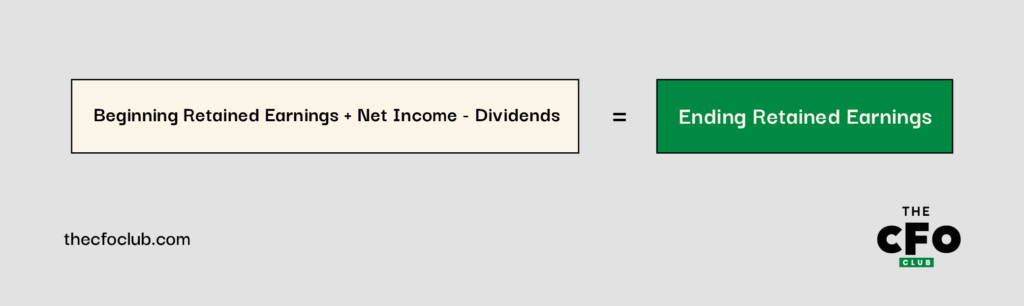
Treasury stock reduces stockholders' equity and is shown as a deduction from total paid-in capital and retained earnings. By carefully forecasting these equity accounts, you complete the picture of your company's projected financial position, ensuring that your balance sheet properly balances with assets equaling liabilities plus equity.
-
Creatio CRM
Visit WebsiteThis is an aggregated rating for this tool including ratings from Crozdesk users and ratings from other sites.4.7 -
LiveFlow
Visit WebsiteThis is an aggregated rating for this tool including ratings from Crozdesk users and ratings from other sites.4.9 -
Float Financial
Visit WebsiteThis is an aggregated rating for this tool including ratings from Crozdesk users and ratings from other sites.4.2
Operationalizing Your Balance Sheet Forecast in Excel
Now that we’ve aligned on approach and forecasting levers, it’s time to shift from framework to function. Let’s walk through building a practical Excel model—one that’s not just mechanically sound, but decision-useful when forecasting your company’s financial position.
1. Gather Historical Data
As I’m sure you know, the foundation of any good forecast is solid historical data. For balance sheet modeling, you’ll want at least two years of clean, consistent data.
Set up your Excel file so the timeline flows left to right. Chronological columns help streamline formula logic and make trends more visually intuitive.
For example:
- Column C: December 31, 2023 (Historical)
- Column D: December 31, 2024 (Historical)
- Column E: December 31, 2025 (Forecast)
- Column F: December 31, 2026 (Forecast)
Historical context isn’t filler; it’s your grounding for building defensible, directional logic. For example, if receivables have hovered around 8% of revenue, you’ll want to test whether that still holds in light of new payment terms, customer mix, or macro conditions.
2. Develop Supporting Schedules and Reclassify
Keep the main balance sheet clean. The real work happens in the supporting schedules. That’s where you’ll surface the assumptions, mechanics, and drivers behind each line, so you can stress-test, update, and explain the model when it matters most.
For example, if you run a tech company, you might create separate schedules for:
- Cash and cash equivalents
- Accounts receivable
- Inventory
- PP&E and depreciation
- Accounts payable
- Debt and interest
Also: don’t let GAAP formatting dictate how you build your forecast. Financial reporting and forecasting serve different goals. If reclassing certain items gets you to a more usable or accurate view, go for it.
Take deferred taxes. GAAP splits them into current and long-term, but if they’re both driven by the same assumptions in your model, combining them may actually bring clarity rather than confusion.
Likewise, catch-all lines like “Other current assets” often hide mismatched drivers. If you operate in the tech space, your “Other current assets” might include prepaid expenses and tax refunds receivable. Prepaids move with OpEx, while tax refunds are tied to effective tax rate and timing. Breaking these out in your forecast will give you a cleaner view of working capital.
That said, don’t overcomplicate things. If two accruals behave the same way—say, compensation and general expenses both scaling with OpEx—roll them up. Simplification is fair game when it improves usability without sacrificing fidelity.
3. Build Dynamic Formulas
Excel's strength in balance sheet forecasting lies in its dynamic formulas. These formulas update automatically when your assumptions change. Rather than hardcoding values, use formulas that link to your assumptions and historical data.
Functions like VLOOKUP, INDEX(MATCH), and SUMIFS help pull historical data into your calculations. For instance, if you forecast accounts receivable as a percentage of revenue, you could use:
=INDEX(Revenue_Range, MATCH(Forecast_Period, Periods_Range, 0)) * AR_Percentage
This method makes your model more flexible and simpler to update. When assumptions change, just update them in one spot. All related calculations will adjust automatically.
Let’s say a SaaS company forecasts accounts receivable at 9% of revenue. If they expect revenue in 2025 to be $600,000, then the accounts receivable forecast will be:
=$E$10*0.09
(Where E10 contains the revenue forecast for 2025.)
Dynamic formulas help with consistency checks. You can set up a check cell to verify if your balance sheet balances. Use conditional formatting to highlight any differences.
Sensitivity analysis is another useful application of dynamic formulas. With data tables or scenario managers, you can see how changes in key assumptions impact your balance sheet.
For this same SaaS company, you can explore how different revenue growth rates affect your working capital needs. You can also examine how changes in capital expenditure influence your cash position:
| Assets | 2023 (Actual) | 2024 (Actual) | 2025 (Forecast) | 2026 (Forecast) |
| Cash and Cash Equivalents | $100,000 | $120,000 | $145,000 | $172,000 |
| Accounts Receivable | $38,000 | $45,000 | $54,000 | $64,800 |
| Inventory | $25,000 | $30,000 | $36,000 | $43,200 |
| Total Current Assets | $163,000 | $195,000 | $235,000 | $280,000 |
| Property, Plant & Equipment | $230,000 | $250,000 | $290,000 | $320,000 |
| Less: Accumulated Depreciation | $(80,000) | $(95,000) | $(115,000) | $(135,000) |
| Net PP&E | $150,000 | $155,000 | $175,000 | $185,000 |
| Total Assets | $313,000 | $350,000 | $410,000 | $465,000 |
| Liabilities & Equity | ||||
| Accounts Payable | $30,000 | $35,000 | $42,000 | $50,400 |
| Accrued Expenses | $15,000 | $18,000 | $21,600 | $25,920 |
| Total Current Liabilities | $45,000 | $53,000 | $63,600 | $76,320 |
| Long-term Debt | $150,000 | $180,000 | $160,000 | $140,000 |
| Total Liabilities | $195,000 | $233,000 | $223,600 | $216,320 |
| Common Stock | $50,000 | $50,000 | $50,000 | $50,000 |
| Retained Earnings | $68,000 | $67,000 | $136,400 | $198,680 |
| Total Equity | $118,000 | $117,000 | $186,400 | $248,680 |
| Total Liabilities & Equity | $313,000 | $350,000 | $410,000 | $465,000 |
| Check (Assets - Liab - Equity) | $0 | $0 | $0 | $0 |
Why Balance Sheets Won’t Balance
A balanced sheet isn't just about adding up numbers. Balancing your 3-statement financial model ensures that your financial projections are consistent and reliable. If you can't get your balance sheet to add up, here are common reasons:
- Signs (+/-) may be incorrect in your formulas: For instance, if you list capital expenditures as negative on the balance sheet, your model will not balance. This often happens with depreciation, which adds back on the cash flow statement but lowers PP&E on the balance sheet.
- Mislinks between statements can create big problems: If your model mistakenly uses dividends instead of stock-based compensation in the common stock schedule, it will be out of balance. These mistakes can be hard to find in complex models.
- Errors in the cash flow statement often cause balance sheet issues: For example, if you assume "other long-term assets" grow like revenues but neglect the cash impact on the cash flow statement, your model won’t balance.
-
Creatio CRM
Visit WebsiteThis is an aggregated rating for this tool including ratings from Crozdesk users and ratings from other sites.4.7 -
LiveFlow
Visit WebsiteThis is an aggregated rating for this tool including ratings from Crozdesk users and ratings from other sites.4.9 -
Float Financial
Visit WebsiteThis is an aggregated rating for this tool including ratings from Crozdesk users and ratings from other sites.4.2
Tips for Balancing the 3-Statement Model
When your balance sheet doesn't balance, it can be frustrating and time-consuming to troubleshoot. Here are some quick tips to help you balance your 3-statement model:
- Make your balance sheet check formula clearly visible at the bottom of your model
- Check all totals and subtotals to ensure no lines are being omitted from calculations
- Verify that you're using consistent signs (+/-) across all statements
- Pay special attention to balance sheet items that affect multiple items in the cash flow statement (like PP&E with CapEx and depreciation)
- Look for patterns in the imbalance—a consistent difference might indicate a constant expense or revenue that's missing
- For slowly increasing/decreasing differences, check items affected by inflation or interest rates
- For jumps in the difference, look at recurring but non-periodic items like debt repayments or capital expenditures
Outside of these quick fixes, regularly reviewing your model is crucial. I suggest a systematic review process. Check your balance sheet after each major change. This helps catch issues early when they are easier to fix.
Benefits and Drawbacks of Balance Sheet Forecasting
Like any tool in your planning arsenal, a balance sheet forecast has its advantages and its limitations. You already know it’s not a crystal ball, but it’s worth flagging a few key strengths and blind spots to stay conscious of as you put it to work:
Benefits
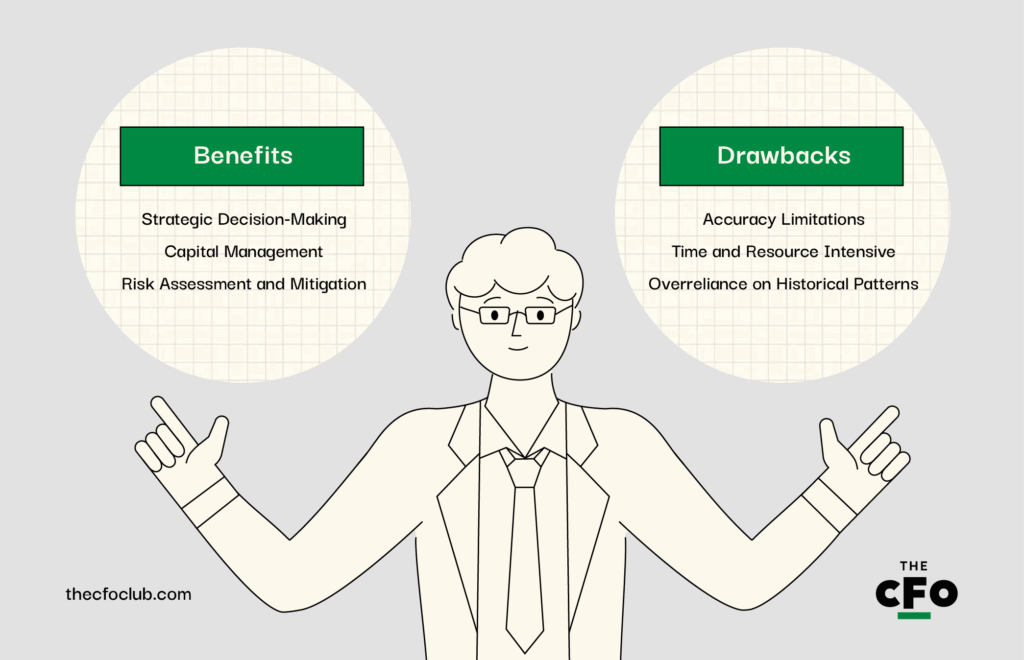
- Strategic Decision-Making: Forecasts help you see the financial effects of decisions like investments or changes in capital structure.
- Capital Management: They help find the right mix of debt and equity, assess capital needs, and plan for future investments.
- Risk Assessment and Mitigation: By projecting assets, liabilities, and equity, you can identify weaknesses and take action to mitigate risks before they happen.
Not forecasting a complete balance sheet is a risky proposition in today’s business environment. Every organization that engages in building and maintaining a budget should have visibility into its future balance sheet. By going beyond the P&L statement and forecasting the balance sheet, financial professionals can help predict the future financial health of the company and provide the visibility needed to stay competitive and successful.
Drawbacks
- Accuracy Limitations: Balance sheet forecasts rely on certain assumptions. Small mistakes in growth rates or ratios can cause major inaccuracies.
- Time and Resource Intensive: Maintaining a detailed forecast requires time and expertise, which can be tough for scrappy startups with limited resources.
- Overreliance on Historical Patterns: Traditional forecasting relies too much on past performance data. This can be risky during market changes or disruptions.
Conculsion
Balance sheet forecasting may never be the flashiest part of the finance function, but it’s undeniably one of the most strategic. No matter where your business is in its growth, the ability to project your company’s financial position with confidence gives you more than just numbers—it gives you control.
You don’t need to be an Excel wizard or fortune teller to build a model that actually works. When you roll forward balances with intention, anchor volatile accounts to operational drivers, and spotlight the big-ticket events that move the needle, your forecast becomes a decision-making engine.
Yes, the work is meticulous. And yes, assumptions can get messy. But with the right structure, some healthy skepticism, and a clear operational rhythm, you can turn forecasting into a source of foresight, not frustration.
Join For More Accounting Insights
Building an accounting career is easier when you have access to expert advice you can trust. Subscribe to our free newsletter for expert advice, guides, and insights from finance leaders shaping the tech industry.