Breaking Down Variance Reports—From Creation to Execution


Explain the Why: CFOs don’t just report the numbers—they explain them. By uncovering the why behind deviations, variance reports become tools that clarify performance drivers and enable smarter, faster decisions across the organization.
Every Number Counts: Each variance—whether it boosts or drags performance—is a feedback loop. These reports reveal where forecasts break down, where assumptions need refining, and where new opportunities or risks are taking shape.
Plan with Precision: Well-structured variance reports provide more than post-mortems; they shape future planning. When built with stakeholder priorities in mind, they become indispensable inputs for budgeting, resource allocation, and long-term growth.
Variance reports show the difference between budgeted outcomes and actual performance metrics, enabling you to plan better next time.
As someone who connects with CFOs and finance leaders every day (often helping them navigate the digital tools behind these numbers), I’ve seen how even the most seasoned professionals can struggle to turn variance reports into truly actionable insights. It’s not about the math; it’s about the message.
This guide is built to help you sharpen both. You’ll learn how to structure your variance reports for clarity, tailor them to stakeholder priorities, and extract the kind of insight that actually shifts strategy.
Whether you're overhauling a stale reporting process or starting from scratch, I’ll walk you through the frameworks, examples, and mindset shifts that can turn a routine report into a forward-looking financial tool. Let’s make your next variance report not just accurate, but indispensable.
What Is A Variance Report?
A variance report, or a ‘variance analysis statement’, is a financial document that compares predicted figures, such as revenue or expenses, with actual numbers over a specific period. It tracks deviations or discrepancies between projected figures and actual results.
You’ll often hear seasoned financial analysts call these differences “budget variance” or just “variance”—it depends on what’s being compared. Budget variance is typically used when comparing financial outcomes against a predefined budget, while “variance” is a more generic term for deviations between any two sets of monetary data.
Like all financial metrics, variances can be either favourable or unfavourable depending on their impact on the bottom line. For instance, earning 20% more revenue than projected in Q1 is a positive variance, while exceeding the quarterly expense budget is a negative variance.
Why Are Variance Reports Important?
As I’m sure you’re well aware of, variance reports can provide critical insights into your company’s financial performance, helping you improve operational efficiency, cost management, and resource allocation for better financial health.
But did you know just how well? Here’s the top reasons most CFOs cite variance reports as a fundamental part of their business:
1. Identify Discrepancies
Comparing actuals to forecasts is standard, but what’s often overlooked is how variance reports help explain why the numbers drift. They do more than flag overages or shortfalls—they reveal underlying patterns that might not be obvious in a standard P&L.
Example: You’re a CFO at an ecommerce company. In a recent review, you notice fulfillment costs came in 20% higher than budgeted. At first glance, it looks like an operational issue, but a closer look reveals a surge in international orders driven by a recent marketing campaign. Thanks to the variance report, that discrepancy was flagged early—well before month-end close—allowing your finance team to adjust spend forecasts and coordinate with operations to manage shipping costs more effectively.
2. Improve Financial Performance
Unfavourable variances often flag underperformance in key areas, but what you might not see at first glance is how they also expose broader patterns in how your assumptions are holding up against reality. Catching these gaps early doesn’t just let you correct the course; it gives you a feedback loop to sharpen your financial modelling and stress-test your strategy.
Example: You’re now the CFO of a manufacturing company and your variance report flags a recurring unfavourable cost variance in raw materials. This result might prompt a supplier renegotiation, but it could also reveal inefficiencies in procurement or point to the need for tighter inventory controls—or even justify investment in automation to cut long-term costs.
On the other hand, let’s say another department shows a favourable labour variance thanks to a pilot shift optimization strategy. That’s not just a pat on the back—that’s a playbook. You now have a clear example of a productivity gain that can be rolled out across other plants or lines to improve margins and boost profitability at scale.
3. Enhance Future Planning and Forecasting
With consistent variance reporting, you gain more than a snapshot of what went wrong or right: you build a clearer lens into what’s coming next. Over time, patterns emerge that you might not immediately see in your month-end summaries.
At this rate, your variances become inputs for smarter forecasting, allowing you to stress-test assumptions and adjust strategic levers across departments.
Example: You’re the CFO of a SaaS company with a growing international user base. A recent variance report flags two issues: customer support costs are 15% over forecast, and churn is rising in EMEA. At first glance, they seem unrelated. But digging deeper, you find the root cause: users in certain regions are facing latency and downtime due to under-provisioned servers, driving up support tickets and cancellations.
With this insight, you reallocate part of your infrastructure budget to improve uptime in those regions, update your forecasting model to account for usage-based scaling, and work with your customer success team to proactively engage high-risk accounts.

4. Facilitate Better Decision-Making
Variance reports do more than track financial performance: they sharpen your decision-making. Beyond flagging discrepancies, they reveal where assumptions are breaking down, where resources aren’t pulling their weight, and where strategic shifts may be overdue.
Example: You’re the CFO of a finance company, and you notice your marketing team overspent by 30% on a recent lead generation campaign, but conversions didn’t follow. When you dig into the variance, it turns out the budget went into broad paid ads that missed your target audience. With that clarity, you decide to shift future spend toward higher-performing channels like webinars or thought leadership content; areas you know consistently attract more qualified leads and deliver stronger ROI.
Everything Included In Variance Reports
You already know the core elements of a variance report, but how you structure and present them can be the difference between a routine update and a decision-making tool. Before we get into how to build an effective variance report, it’s important to revisit the basics, like what’s typically included:
- Budgeted Figures and Actual Results: Budgeted figures are the projections for a specific window, such as expected expenses or revenue. They serve as yardsticks against which actual outcomes are measured.
- Variance Calculations: This is the difference between budgeted figures and actual results, which guides the rest of the analysis.
- Variance Explanations and Analysis: Variance explanations identify the reasons for the deviations and categorize them as favourable vs. unfavourable, highlighting areas and possible causes of underperformance.
- Actionable Insights: Based on the analysis, a variance report should include corrective measures to address the discrepancies and strategies to sustain favourable outcomes.
Types of Variances Included In Reports
In most reports, the variance you’re calculating ties back to familiar drivers: cost, revenue, or timing. These categories aren’t new to you, but the real value comes from what’s shifting underneath them.
So while you probably know the usual suspects, let’s walk through the core types of variances and dig into what each one might really be signalling:
- Cost Variance: This reflects the difference between what you planned to spend and what you actually spent. Let’s say you lead finance for a manufacturing firm and had budgeted $75,000 for raw materials in July 2025. But due to supplier pricing changes, that cost jumps to $85,000. That $10,000 overage is more than just an unfavourable variance—it’s a signal to revisit vendor contracts or reassess input cost assumptions.
- Revenue Variance: Here, the focus is on the gap between projected and actual income. Imagine your team forecasts $7 million in Q3 revenue based on Q2 performance. But you end up pulling in $7.4 million thanks to a seasonal boost in consumer demand. That $400,000 bump is a favourable variance, and it may signal a shift in buyer behavior or a channel strategy that’s outperforming expectations.
- Schedule Variance: This shows how your timelines are tracking, whether things are on schedule, ahead, or delayed. Say you’re overseeing a construction project set to wrap by June 30, 2025, and everything finishes on time. That’s a zero schedule variance. But had the project been delayed, even by a week, you’d be looking at potential downstream impacts across resource planning and billing cycles.
Creating A Variance Report
Alright, now let’s put everything into play. Whether you’re tightening up a process you’ve used for years or starting fresh, this step-by-step guide will help you build a variance report that does more than check a box.
1. Collect and Organize Data
Before you run any analysis, you need to be clear on which metrics matter. Start by identifying the key categories that drive your business performance, whether that’s by department, cost center, or revenue stream.
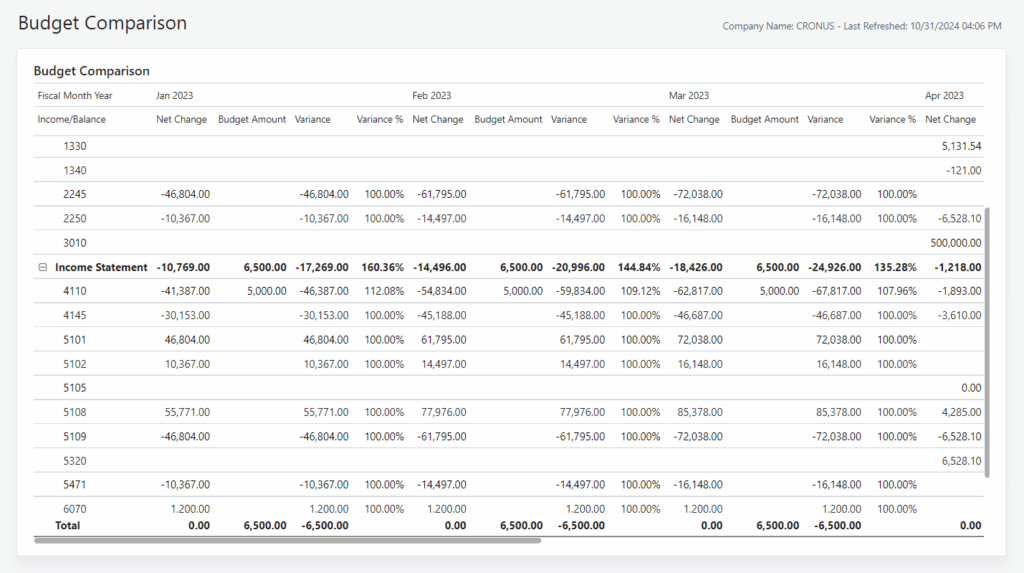
A simple, well-structured data table works best here. It lets you lay out the predicted numbers alongside the actuals, side by side. One column for the budgeted figures during your reporting period, another for the actuals.
Take this budget variance layout for example, created by Microsoft’s Business Central in Power BI for a fictional company, CRONUS:
2. Pick A Variance Method
Now, for the fun part. There are two variance methods you can apply in your analysis: percentage or absolute value.
The percentage formula looks a little like this:
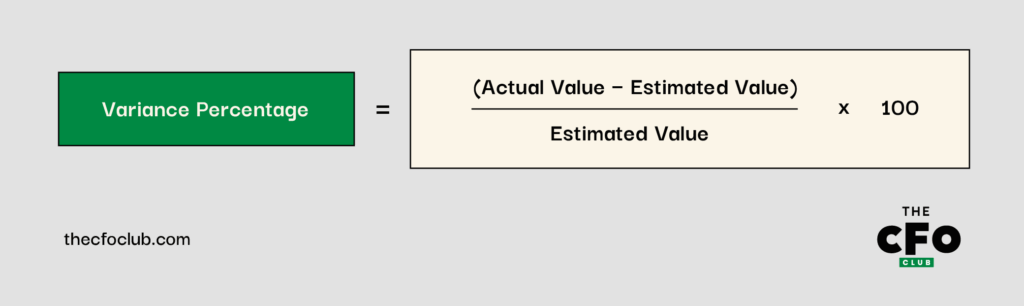
Say your manufacturing firm reviewed its Q3 budget report and noticed that your estimated amount of $900,000 came out to an actual amount of $600,000. Using the percentage formula, you’d uncover that you earned 33.3% more than initially projected:
($600,000 - $900,000) x 100 = -$30,000,000 ÷ $900,000 = -33.3%
Another variance method is the dollar value. It looks like this:
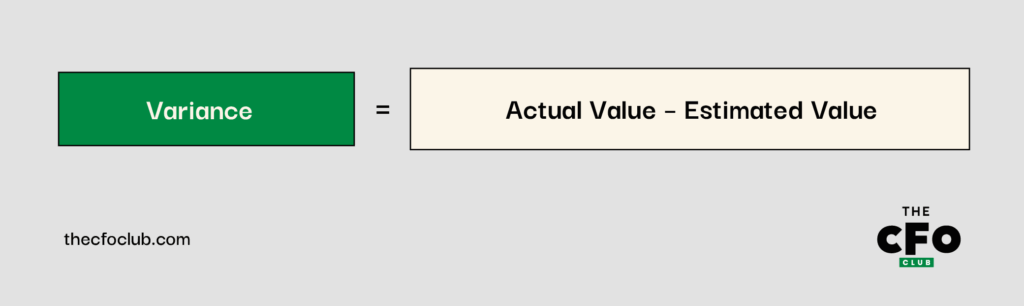
Using the dollar value method, you can find out how much that 33.3% actually works out to:
($600,000 - $900,000) = -$300,000
3. Arrange The Report and Compare Results
Now that you’ve pulled the actuals and forecasts, it’s time to line them up and calculate the variances.
Mark each one as favourable or unfavourable—not just to check the box, but to clearly surface where performance is exceeding expectations and where it’s falling short. This isn’t just a numbers exercise; it’s about drawing attention to the areas that warrant a closer look and, ultimately, a strategic response.
Here’s how the budget variance report might look for a manufacturing firm covering its revenue and costs for Q1 2025:
| Metric | Estimated Value ($M) | Actual Value ($M) | Variance ($) | Variance (%) | Variance Type |
| Revenue | 700 | 750 | 50 | 7.1% | Positive |
| Labor costs | 315 | 350 | 35 | 11.1% | Negative |
| Material costs | 20 | 20 | 0 | 0% | Positive |
What do you gain from this example?: When you lay out the numbers clearly, the story reveals itself. In this case, the manufacturing firm outperformed its Q1 revenue forecast by 7.1%—a solid top-line surprise.
But that upside came with a tradeoff: labour costs ran 11.1% over budget, which may point to overtime, staffing inefficiencies, or unexpected demand.
On the upside, spend on production materials landed right on target, resulting in a zero variance, which is always a good sign that procurement and planning were aligned.
4. Explain The Variance
Once you’ve identified a variance, the real value comes from explaining why it happened and what’s next. As a CFO, this isn’t just about transparency; it’s about showing that you understand the drivers and have a plan to respond.
Forecasts reflect the organization’s view on the future. How close they end up being to reality is a measure of the effectiveness and accuracy of its analysis.
Say your finance team at a manufacturing company reports a negative labour cost variance. Instead of stopping at the number, you dig in and uncover increased overtime, unexpected turnover, and rising wage pressures. That explanation reframes the variance as part of a broader workforce challenge with strategic implications.
Clear, confident explanations like this don’t just reassure stakeholders. They help guide smarter decisions going forward.
Real-World Variance Report Examples
If there’s one thing most CFOs agree on, it’s this: a good example goes further than a dozen theoretical frameworks. So let’s look at how strategic variance reporting plays out in the real world:
Indiana University
The Controller's Office of Indiana University published a variance analysis template, setting a standard for financial reporting across all of its entities.
For the 2023 academic year, the report places total realized revenue at $14.04M, instead of the budgeted $17.2M, creating a negative variance of 18.42%.
When you take a closer look at a specific line item like instructional student fees for Spring (INSS), they projected $6.2M in revenue but made $0 in actual revenue, which is a percentage difference of 100%.
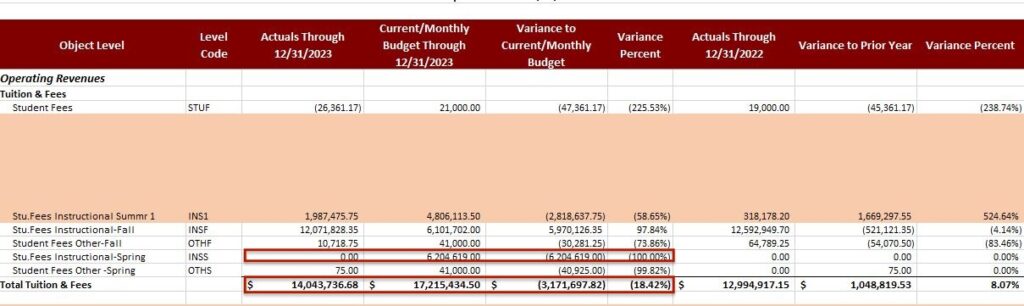
While academic in context, this template can be applied in any industry—simply adjust the metrics and specify the reporting period.
Good vs. Poor Variance Reports
Variances can be positive or negative, depending on how they affect your company’s financial health. Here’s how to tell which belongs in what category:
Positive Variance
A positive variance is a deviation that occurs when actual numbers are better than expected. Think about that time operational costs fell below the proposed budget or monthly revenue surpassed your initial predictions. Such variances indicate effective cost control, improved sales, and higher profit margins.
Example: Take Oracle’s Q4 FY2025 earnings for instance. The global IT player reported a $15.9 billion revenue, surpassing analysts’ $15.59B projection. This equals a $0.31B or 1.9% variance in Oracle’s favour.
On the surface, it’s a strong quarter. But from a strategic CFO lens, this kind of variance opens up key conversations. For one, it signals that market demand or sales execution exceeded expectations. It also gives the finance team the opportunity to assess why the overperformance happened.
Negative Variance
This discrepancy arises when key metrics fall short of expectations, such as when revenue is lower or costs are higher than anticipated. Negative variances signify a decline or deficit in crucial areas. If left unchecked, this may result in crippling debts and a shortage of cash flow.
Unfavourable variances typically appear as negative values (e.g., -20,760.00 or -5%), but this doesn’t always apply to cost or price variance. When the actual cost is higher than the budgeted cost, it’s reflected as a positive value, which doesn’t necessarily translate to good business outcomes.
Example: By Q2 of fiscal year 2025, DR Horton’s EPS stood at $2.58, missing the $2.69 Consensus EPS by 4%. You can interpret the negative EPS variance as -4% or -$0.11.
A negative EPS variance can point to softening demand, rising costs, or forecasting missteps, all of which can shake investor confidence and put pressure on long-term planning. It doesn’t just impact the current quarter; it can restrict access to capital, delay key initiatives, and force a shift in strategic priorities.
Tips To Improve Your Budget Variance
Even seasoned finance leaders hit bumps. Maybe market conditions shifted, a department went off course, or assumptions didn’t hold. If your variances aren’t where you want them to be, here are a few practical ways to tighten the process and get back on track:
- View Current Performance Data: Knowing what you do now about the importance of variance reporting in financial planning, take a deep dive into that report. From the negatives and the positives, identify underperforming metrics and strategize on solutions, one step at a time.
- Use Real-time and Historical Data to Inform Forecasts: Insights from previous variance reports enable you to create realistic budgets in the future. But it doesn’t stop there. Future budgets should also reflect changing market conditions, ensuring accurate forecasts and more positive variances.
- Explore All What-if Scenarios: Your forecasting model should anticipate all possible outcomes (including those influenced by internal vs. external factors) and adjust subsequent budgets to accommodate them. This proactive approach fortifies your company against shocks like cost increases or demand fluctuations, without necessarily causing a negative budget variance.
- Ask the Right Questions: This will help you uncover the insights you need to optimize your budget variance. Some common questions include: What's happening in the budget? Where is the variance occurring? Is the available data accurate? Do I need to adjust for changes in market conditions?
When Is Variance Reporting Necessary?
Variance reports are always useful, but at key moments, they become essential. When the stakes are high or the landscape shifts, a well-timed report gives you the clarity and confidence to act fast, and get it right.
Here are some of the times when variance reporting really earns its place at the table:
- Quarterly. Variance analysis is relevant to a quarterly earnings report because it shows stakeholders how your company’s performance compares to their expectations. Consequently, this creates room for dialogue and strategic collaboration.
- Throughout a Project’s Lifecycle. Project managers rely on variance reports to track project costs, monitor overruns, and ensure resource management. The report also helps improve budget forecasting for similar future projects.
- During Budget Reviews. Most companies review budgets periodically to ensure efficient resource allocation. These reviews are typically informed by past budget variances for the entire company or individual departments.
Overall, the company’s operational scale and resources dictate the timing and frequency of variance reports.
Variance Reports Made Easy—With Software
Variance analysis can be time-consuming, especially if you have to report on several metrics over an extended period. Throw in the potential for human error and doing it alone, and you’re halfway to overwhelm land.
Avoid all these challenges by relying on analytics and financial reporting software, like many CFOs do. Here are our top recommendations to do the same.


Subscribe to Compound Your Finance Knowledge
Want to stay ahead of the curve? Join The CFO Club to access expert advice and actionable insights from top finance leaders globally.