Gross Margin Percentage: What Tech Investors Want to See
Having a clearly computed gross margin percentage helps you weave a story on the road to getting funded.
To tell that story, though, you need to know how investors are expecting you to calculate these numbers.
Here's what you need to know to calculate a investor-friendly figure.
Gross Margin Definition
Gross margin measures gross profit as a percentage of total revenue. Gross margin may also be known as gross margin on sales, gross profit margin (GPM), or gross margin percentage.
The gross margin calculation shows the viability of your business model, indicator of scalability, and ability to both pay operating expenses and reinvest into your business.

Why Does Gross Margin Matter?
Gross margin percentage is a clear sign of a company's financial health and growth potential. In other words, it shows you whether or not a business has achieved product-market fit and is ready to grow.
While high gross margin is a good precursor for a company's overall profitability, it may not always paint the full picture for some companies.
Many costs occur in the early stages of research and development, so a net profit margin may not accurately reflect your scalability. If your business is established and has already found product-market fit, investors will want to see a gross margin of 75%+ across most industries.
Should I Use Gross Margin if I'm Pre-PMF?
If you're looking for investors and your company hasn't yet reached product-market fit, gross margin likely won't be the best metric to use.
I say this because your revenue is going to experience a lot of fluctuations and you won't even quite know what the growth plan for your company ought to be.
In this kind of scenario, you should look to find angel investors, raise a friends & family round, or tap into alternative sources of business funding.
Gross Margin Percentage vs Rule of 40
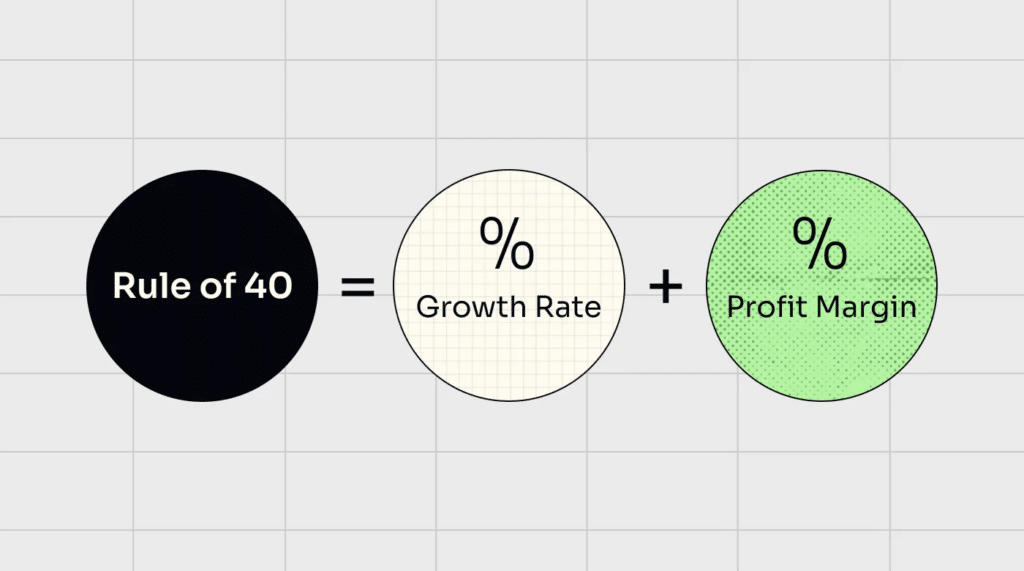
Some operators prefer to use the Rule of 40 as a guiding figure for their business. This rule states that a firm's annual growth rate plus profit margin should be equal to or greater than 40%.
If you're a profitable, growing company but your gross margin percentage is less than 75%, the Rule of 40 could be a better metric to lead investor discussions with.
It allows you to showcase growth as a leading factor for investors to consider when evaluating your business; however, a McKinsey analysis of more than 200 SaaS firms found that only 16% of the firms passed the Rule of 40 consistently.
If you can use it, consider doing so. If not, don't worry - not many can.
Calculating Gross Margin %
Gross margin is found by subtracting the Cost of Goods Sold (COGS) from net revenue.
For SaaS companies — aka those with some of the most confusing gross margin calculations — COGS could include:
- Web hosting
- Software
- Server fees
- Development expenses (salaries, technology, equipment)
- Customer support (if deemed necessary for revenue retention)
The exact components will depend on your company's operations and business model.
Here's how you figure out the percentage:
Gross Margin = (Revenue - COGS) / Revenue
For example, if you sell a product with a lifetime value of $1,000 and it costs $300 for you to make, sell, and maintain that product, you're keeping 70% of what you earned.
Thus, your gross profit margin is 70%.
Most accounting software will have an automatic gross margin calculation, which will result in more accurate, timely figures for your firm.
Why Gross Margin Matters More than Revenue
Taken alone, revenue tells investors a lot less than gross margin can. Imagine that you were your target investor, evaluating multiple investment opportunities.
Two firms seem viable, however, Company A has $2.5M in revenue, whereas Company B has $2M in revenue. Taken alone, Company A would seem more viable.
But if your gross margin calculations show you that Company A has a gross margin of 65% compared to Company B's 80% margin, the attractiveness flips.
By focusing on this gross margin percentage, you can ensure that you're always evaluating sustainable, scalable business growth as opposed to short-term revenue gains.
How To Improve Your Gross Margin
Here are some recommendations for crafting an upward charting path for your business.
- Lower your customer acquisition costs (CAC) by analyzing which platforms and campaigns give the best results and focusing on them.
- Think about implementing different pricing strategies, such as Buy Now Pay Later (BNPL), which lets customers pay in flexible installments.
- Look into new sources of funding and have a contingency plan, even if you don't think you need it right now.
- Don't offer discounts to increase Average Contract Value (ACV). While they may seem like an appealing strategy, discounts usually decrease customer lifetime value, affect the churn rate, and make renewals more difficult.
For more tips on improving your financial metrics, access to free templates, and the latest news in tech finance, be sure to sign up for our weekly newsletter.