13 Best Tableau Alternatives Reviewed in 2026

Best Tableau Alternatives Shortlist
Here’s my shortlist of the best Tableau alternatives:


In the world of finance, you face constant pressure to make data-driven decisions quickly. You might find Tableau isn't meeting your needs, whether due to cost, complexity, or lack of specific features. Business Intelligence software can help you tackle these challenges by providing tools that fit your unique requirements.
I've independently tested and reviewed several alternatives, focusing on what sets them apart from Tableau. In this article, I'll share my top picks, keeping your need for efficiency, flexibility, and ease of use in mind. You'll find solutions that align with your team's goals and budget, helping you stay ahead in the competitive finance landscape.
What Is Tableau?
Tableau is a business intelligence software that helps you visualize and understand data through interactive dashboards and reports. It's commonly used by data analysts, business managers, and financial professionals who need to make informed decisions based on data insights. Data visualization, data blending, and real-time analytics capabilities help with uncovering trends, making quick decisions, and improving data interpretation. Tableau provides overall value by turning complex data into actionable insights for you and your team.
Best Tableau Alternatives Summary
This comparison chart summarizes pricing details for my top Tableau alternative selections to help you find the best one for your budget and business needs.
| Tool | Best For | Trial Info | Price | ||
|---|---|---|---|---|---|
| 1 | Best for transforming spreadsheets into data apps | Free plan available | From $49/month (billed annually) | Website | |
| 2 | Best for no-code integrations | Free demo available | Pricing upon request | Website | |
| 3 | Best for real-time insights and scalability | Free demo available | Pricing upon request | Website | |
| 4 | Best for real-time decision-making | 30-day free trial + free demo available | Pricing upon request | Website | |
| 5 | Best for open-source flexibility | Free plan available | From $100/month + $6/user/month | Website | |
| 6 | Best for AI-driven insights | 14-day free trial + free demo available | From $25/user/month (billed annually) | Website | |
| 7 | Best for customizable embedded analytics | Free demo available | Pricing upon request | Website | |
| 8 | Best for AI-enabled data storytelling | Free 30-day trial + free demo available | Pricing upon request | Website | |
| 9 | Best for Microsoft product integration | Free plan available | From 1$4/user/month (billed annually) | Website | |
| 10 | Best for strategy execution | 30-day free trial + free demo available | Pricing upon request | Website |
Why Trust Our Software Reviews
-

LiveFlow
Visit WebsiteThis is an aggregated rating for this tool including ratings from Crozdesk users and ratings from other sites.4.9 -
Float Financial
Visit WebsiteThis is an aggregated rating for this tool including ratings from Crozdesk users and ratings from other sites.4.1 -
Rippling Spend
Visit WebsiteThis is an aggregated rating for this tool including ratings from Crozdesk users and ratings from other sites.4.8


Best Tableau Alternatives Reviews
Below are my detailed summaries of the best Tableau alternatives that made it onto my shortlist. My reviews offer a detailed look at the key features, pros and cons, integrations, and ideal use cases of each tool to help you find the best one for you.
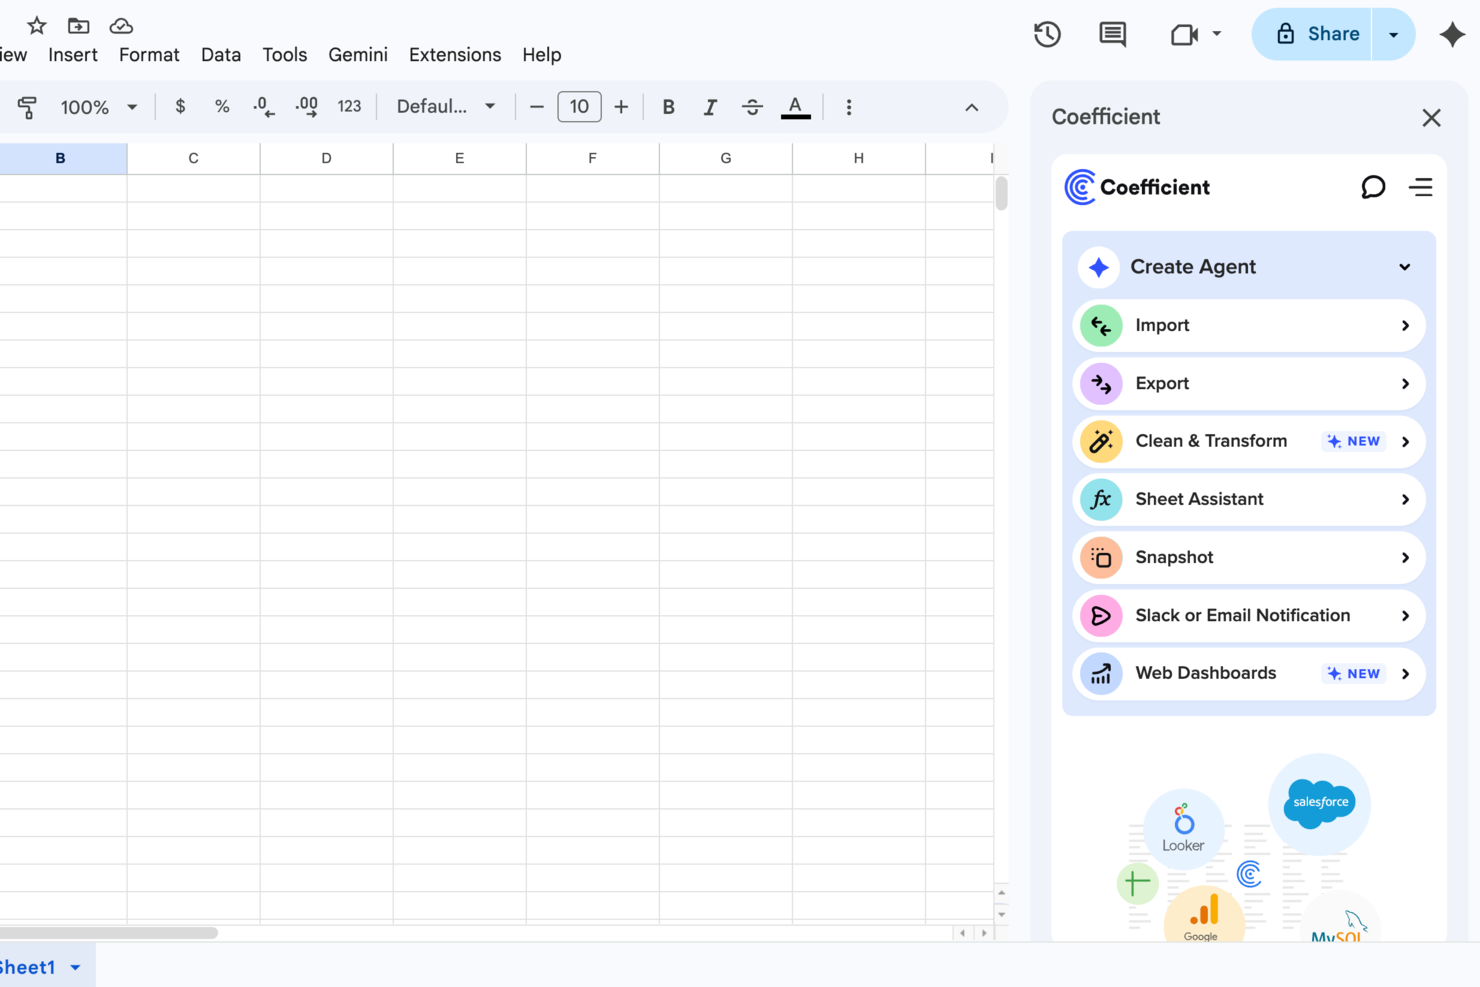
For teams seeking a versatile alternative to Tableau, Coefficient presents a unique approach by smoothly integrating with Google Sheets and Excel to bring real-time data connectivity to over 100 sources. It appeals to professionals in revenue operations, marketing, and finance, offering them the ability to automate data processes and create interactive dashboards without the need for extensive technical expertise. By bridging the gap between complex data systems and user-friendly spreadsheets, Coefficient addresses the need for efficient data analysis and reporting, making it a valuable tool for those looking to improve their data-driven decision-making.
Why I Picked Coefficient
I picked Coefficient as a compelling alternative to Tableau due to its ability to transform spreadsheets into powerful data applications. With features like AI-driven modeling for forecasting and interactive live web dashboards, Coefficient empowers your team to perform complex data analysis directly within the familiar environment of Google Sheets and Excel. This tool is particularly valuable for teams looking to automate web research and enrich data without leaving their spreadsheets. The ease of creating custom alerts via Slack or email for data changes further improves its appeal for businesses aiming to maintain agility and responsiveness.
Coefficient Key Features
In addition to its transformative capabilities, I also found several features that reinforce Coefficient's utility as a Tableau alternative.
- Prebuilt Connectors: Provides over 100 prebuilt connectors for smooth integration with various systems, allowing you to unify disparate data sources easily.
- Data Applications: Enables users to build data applications directly from spreadsheets without any coding, enhancing accessibility for non-technical team members.
- AI Tools: Offers AI capabilities for data cleaning and transformation, ensuring your data is always ready for analysis.
- Templates: Includes ready-made templates for commission trackers, financial forecasts, and marketing dashboards to expedite your setup process.
Coefficient Integrations
Integrations include Salesforce, HubSpot, Pipedrive, Google Analytics, Facebook Ads, Mailchimp, Snowflake, PostgreSQL, MySQL, Tableau, and more.
Pros and Cons
Pros:
- Complex analysis inside spreadsheets
- Templates speed up dashboard setup
- No-code apps built from spreadsheets
Cons:
- Fewer BI features than competitors
- Data connectors are sometimes unstable
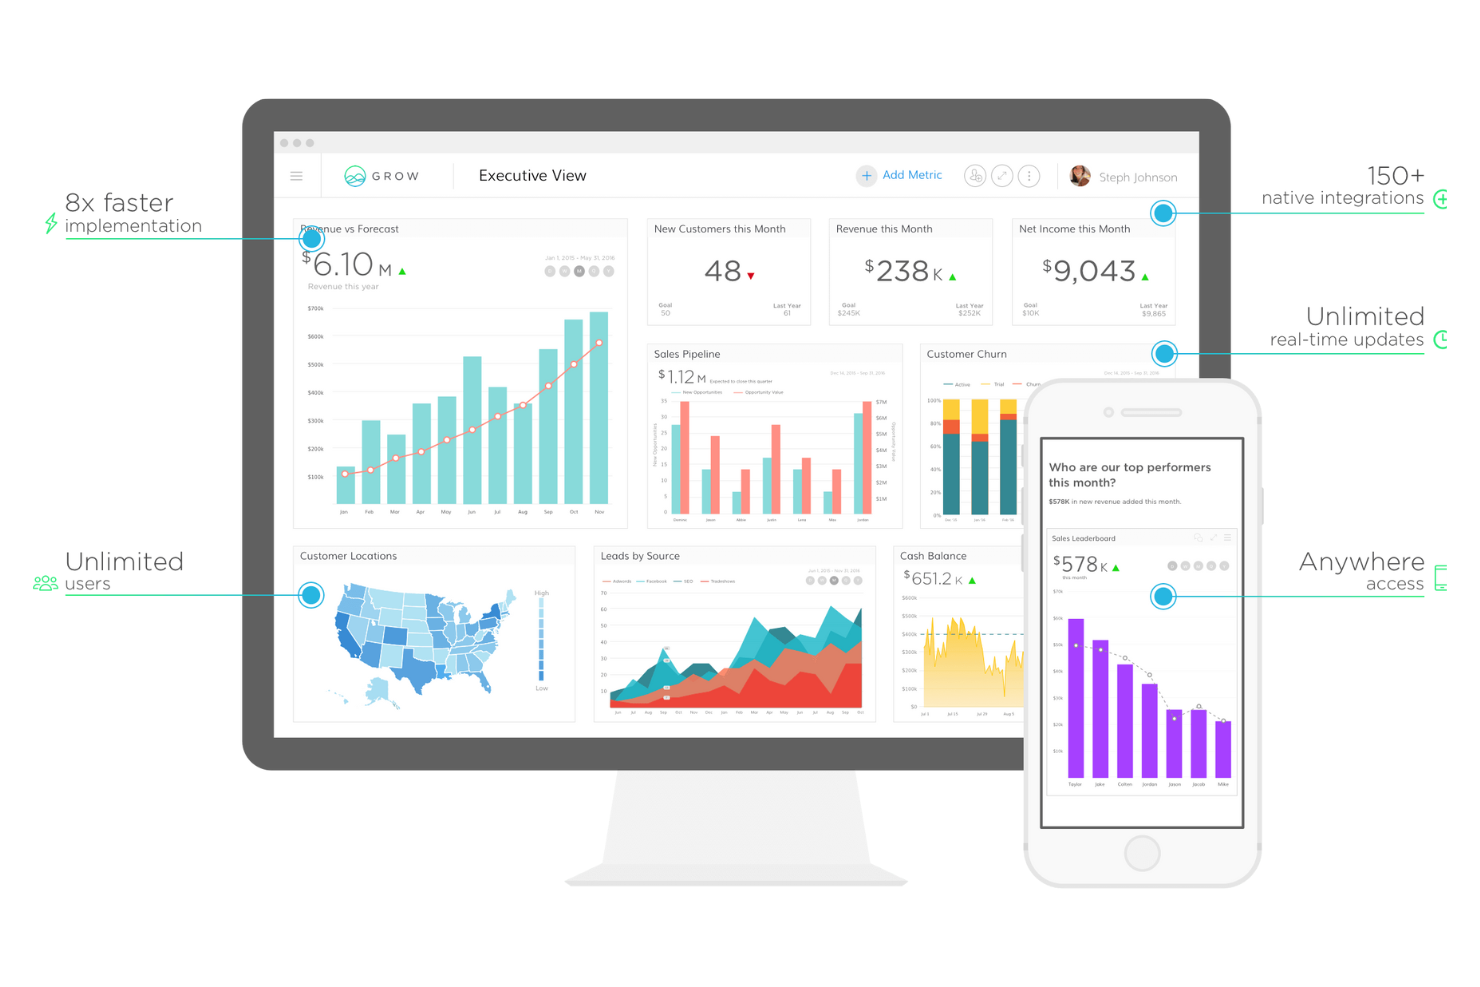
Grow is a BI platform for small to medium-sized businesses that enables data visualization, analysis, and data-driven decision-making through an easy-to-use, no-code interface that connects to various information sources.
Why Grow is a good Tableau alternative: Grow's no-code functionality makes it highly accessible for teams without technical expertise. Its user-friendly interface allows you to create dashboards quickly, supporting informed, on-the-go decisions.
Standout Features and Integrations:
Features include customizable dashboards and real-time data updates that enable you to tailor data views to your team's needs and access the most up-to-date information. The platform's drag-and-drop interface simplifies report building and editing.
Integrations include Salesforce, QuickBooks, Google Analytics 360, HubSpot, Shopify, Stripe, Xero, Amazon S3, Mailchimp, WooCommerce, and more.
Pros and Cons
Pros:
- No-code, full-stack platform
- Extensive prebuilt connectors to data sources
- Unlimited users and dashboards
Cons:
- Basic data modeling limits scalability
- Inability to archive data
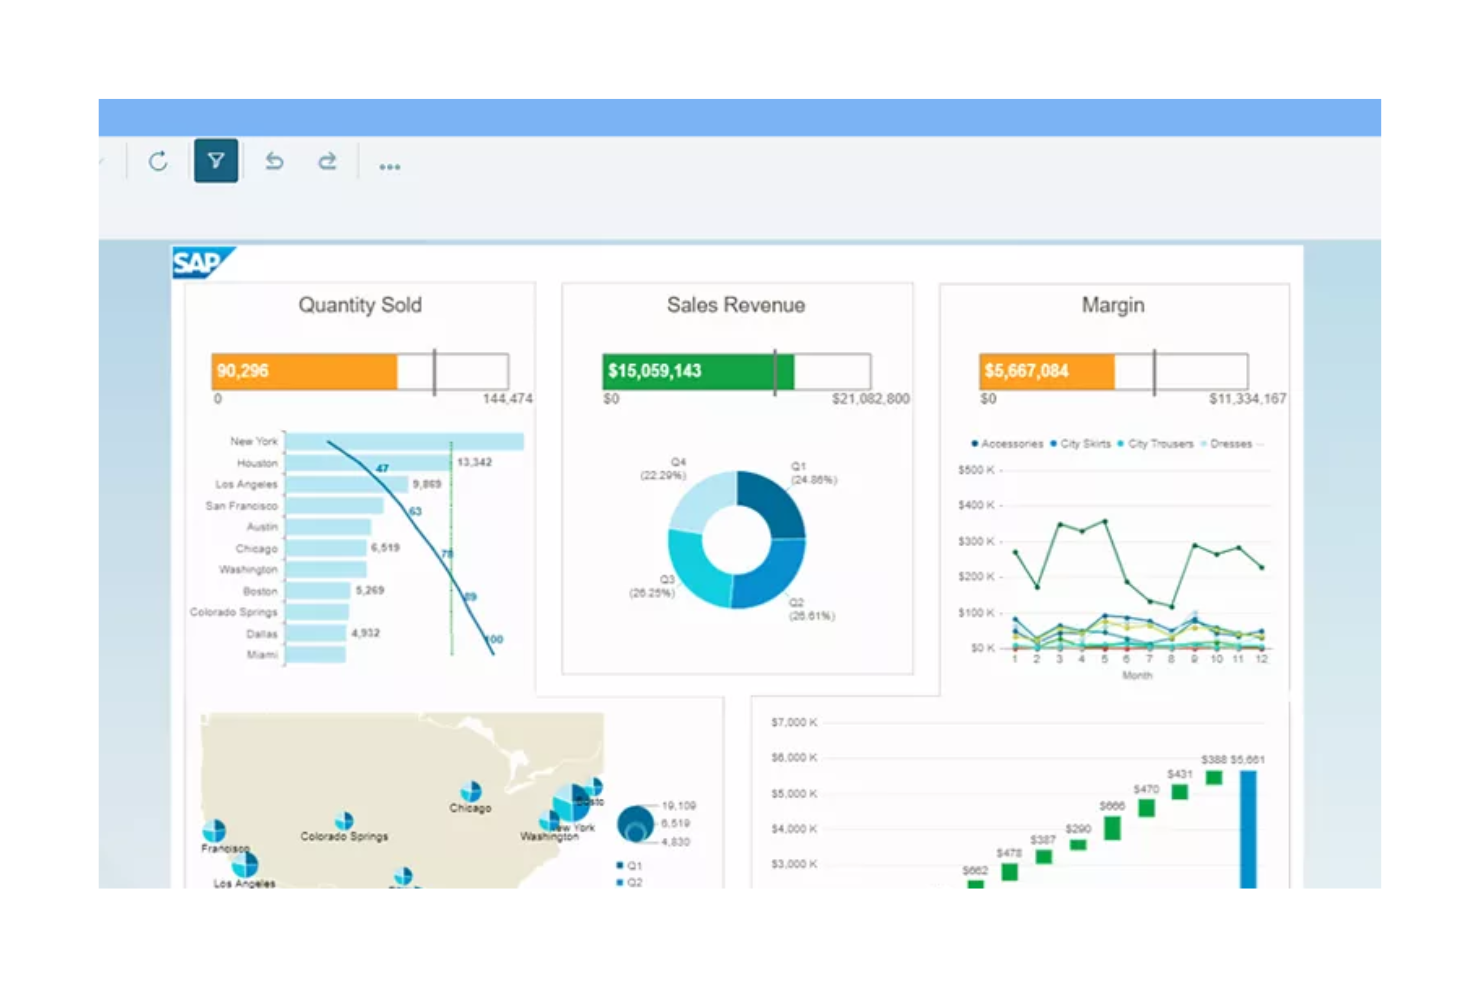
SAP's BI solutions enable data analysts and business managers to gather, visualize, and analyze data to make informed decisions.
Why SAP is a good Tableau alternative: SAP offers real-time data insights and scalability, making it suitable for large enterprises with extensive data needs. Its advanced analytics and data management capabilities support real-time decision-making for complex business environments. The platform's scalability ensures it can grow with your business and accommodate increasing data volumes. SAP's integration capabilities provide an in-depth view of your business operations by connecting diverse data sources.
Standout Features and Integrations:
Features include data visualization, predictive analytics, and data integration. Powerful tools enable you to create interactive dashboards that transform complex data into actionable, visually straightforward metrics. The predictive analytics feature helps you forecast future trends, while data integration allows you to combine data from multiple sources into a single view. SAP also provides built-in connectors, APIs, and prepackaged integration flows, accelerating connectivity to third-party applications, such as Microsoft Excel, Salesforce, and Microsoft Azure.
Integrations include SAP S/4HANA, SAP Ariba, SAP SuccessFactors, Oracle, and more.
Pros and Cons
Pros:
- Predictive analytics capabilities
- Highly scalable, cloud-based solutions
- Real-time data analysis
Cons:
- Complex setup and deployment
- High total cost of ownership for small businesses
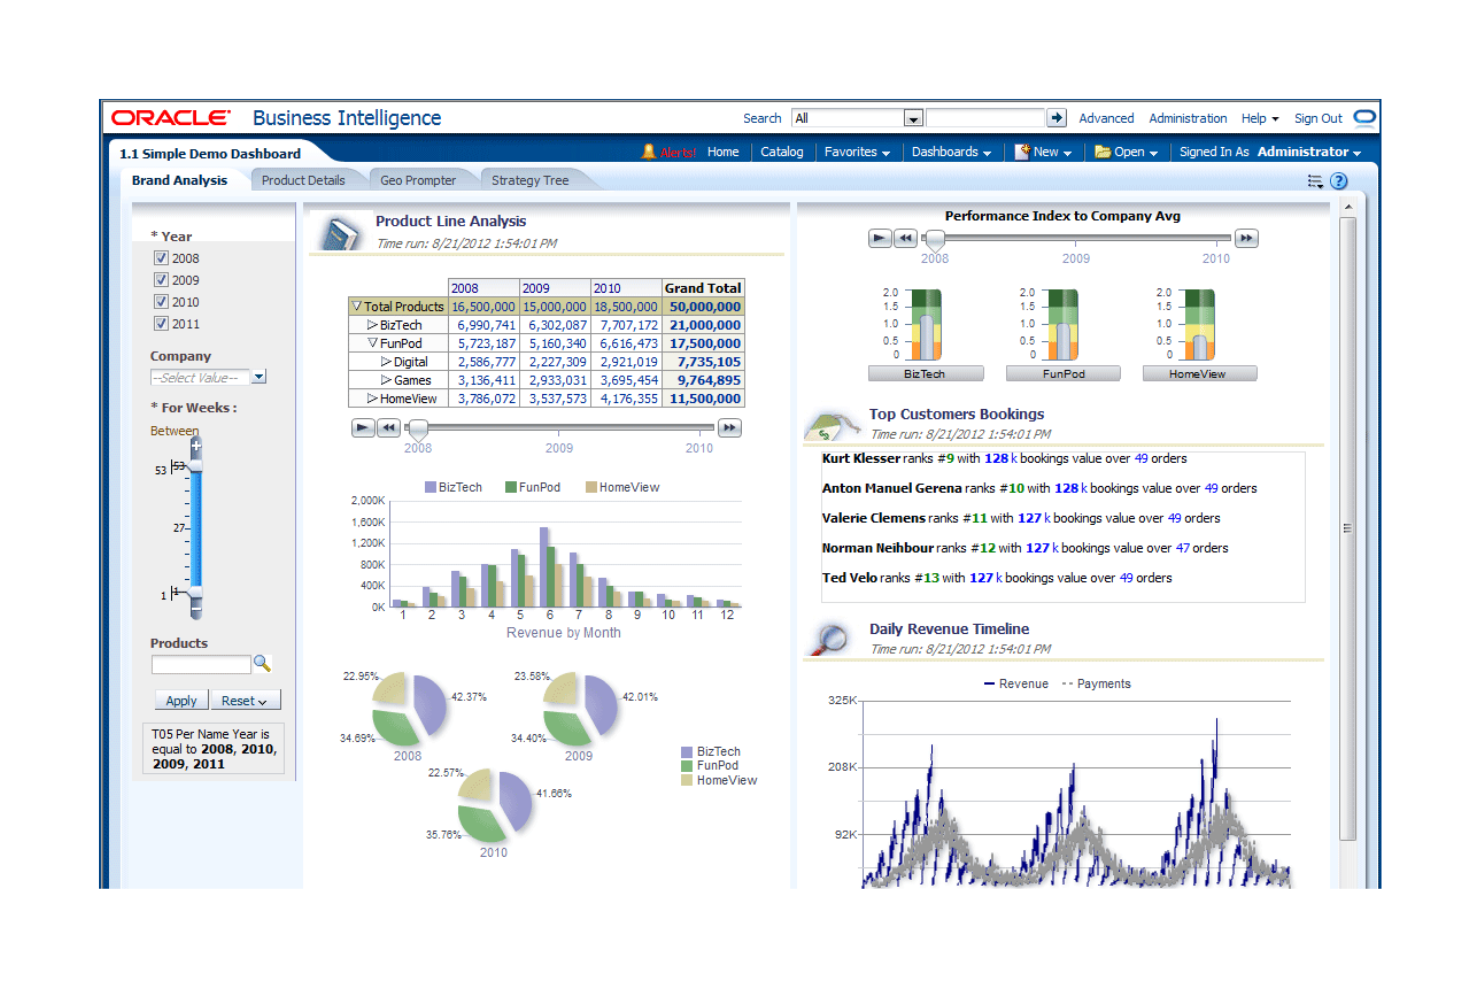
Oracle BI is a suite of technologies and applications for data analysts and business managers, offering reporting, ad hoc querying, and analysis to enable informed strategic decisions.
Why Oracle BI is a good Tableau alternative: Oracle BI excels in real-time decision-making, immediate data insights, and augmented statistical analysis. Oracle BI's integration with other Oracle products offers a unified, secure, and high-performance analytical environment.
Standout Features and Integrations:
Features include tools for complex data modeling and advanced analytics. Interactive dashboards allow for intuitive, self-service data visualization. The real-time reporting tool provides access to live transactional data.
Integrations include Oracle Databases and Cloud, Salesforce, Microsoft Excel, IBM Db2, Amazon Redshift, Google Analytics, Microsoft Dynamics 365, and more.
Pros and Cons
Pros:
- Integrated, end-to-end EPMS
- Prebuilt BI applications
- Real-time data processing
Cons:
- High resource dependency
- High licensing and ownership costs
Metabase is a BI tool that provides graphs and visualizations for data exploration. It primarily caters to teams looking to democratize data access and to companies building customer-facing analytics. It allows you to connect to research and examine datasets from various sources, including spreadsheets, and create interactive dashboards.
Why Metabase is a good Tableau alternative: Metabase offers open-source flexibility, making it an attractive option for customization. The platform supports multiple data sources, providing extensive versatility for querying information from various databases and warehouses. Metabase is a scalable software that accommodates growing businesses and different user requirements.
Standout Features and Integrations:
Features include a visual query builder that acts as a graphical, no-code/low-code interface for exploring data. Metabot AI-powered natural language querying helps you gain insights quickly. Customizable interactive dashboards allow your team to tailor data presentations to specific needs.
Integrations include Exasol, Cube, Databricks, Dremio, Druid, DuckDB, Firebolt, Google Sheets, Hydra, MariaDB, Snowflake, and more.
Pros and Cons
Pros:
- Highly suitable for on-premise operations
- Offers a feature-rich free version
- Built-in SQL editor
Cons:
- No cross-database joins
- No native advanced analytics
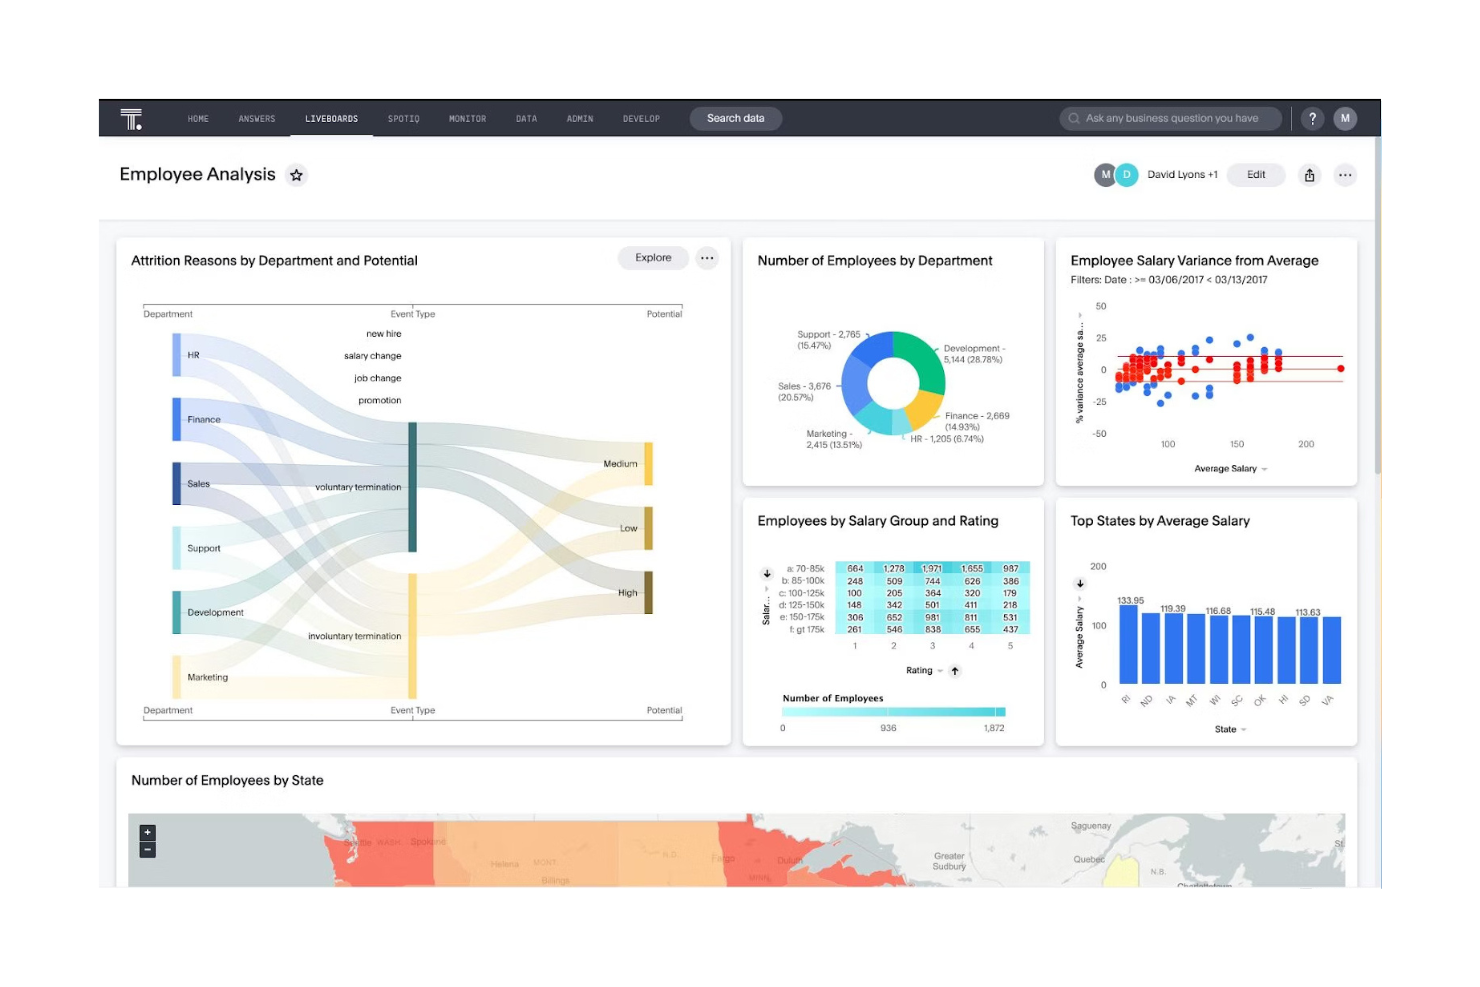
ThoughtSpot is a BI and analytics platform for data-driven teams and enterprises. It enables you to gain insights through a search-driven interface and AI-powered data exploration.
Why ThoughtSpot is a good Tableau alternative: ThoughtSpot provides automated insights, trend analysis, anomaly alerts, and forecasting to help you identify patterns and make data-driven decisions from complex datasets. Its intuitive interface allows you to ask questions in natural language and receive instant, visual answers. The platform's AI capabilities automatically generate insights and recommendations, saving you time. This cloud platform is one of the best BI tools for non-technical users.
Standout Features and Integrations:
Features include search-driven analytics for simple data exploration, AI-powered insights for automated analysis, and a scalable, cloud-native architecture to handle large datasets.
Integrations include Google BigQuery, Snowflake, Amazon Redshift, Microsoft Azure Synapse, Databricks, SAP HANA, Oracle, Salesforce, and more.
Pros and Cons
Pros:
- Natural language querying
- Scalable for massive datasets
- AI-driven, proactive insights
Cons:
- Limited visualization options
- UI constraints
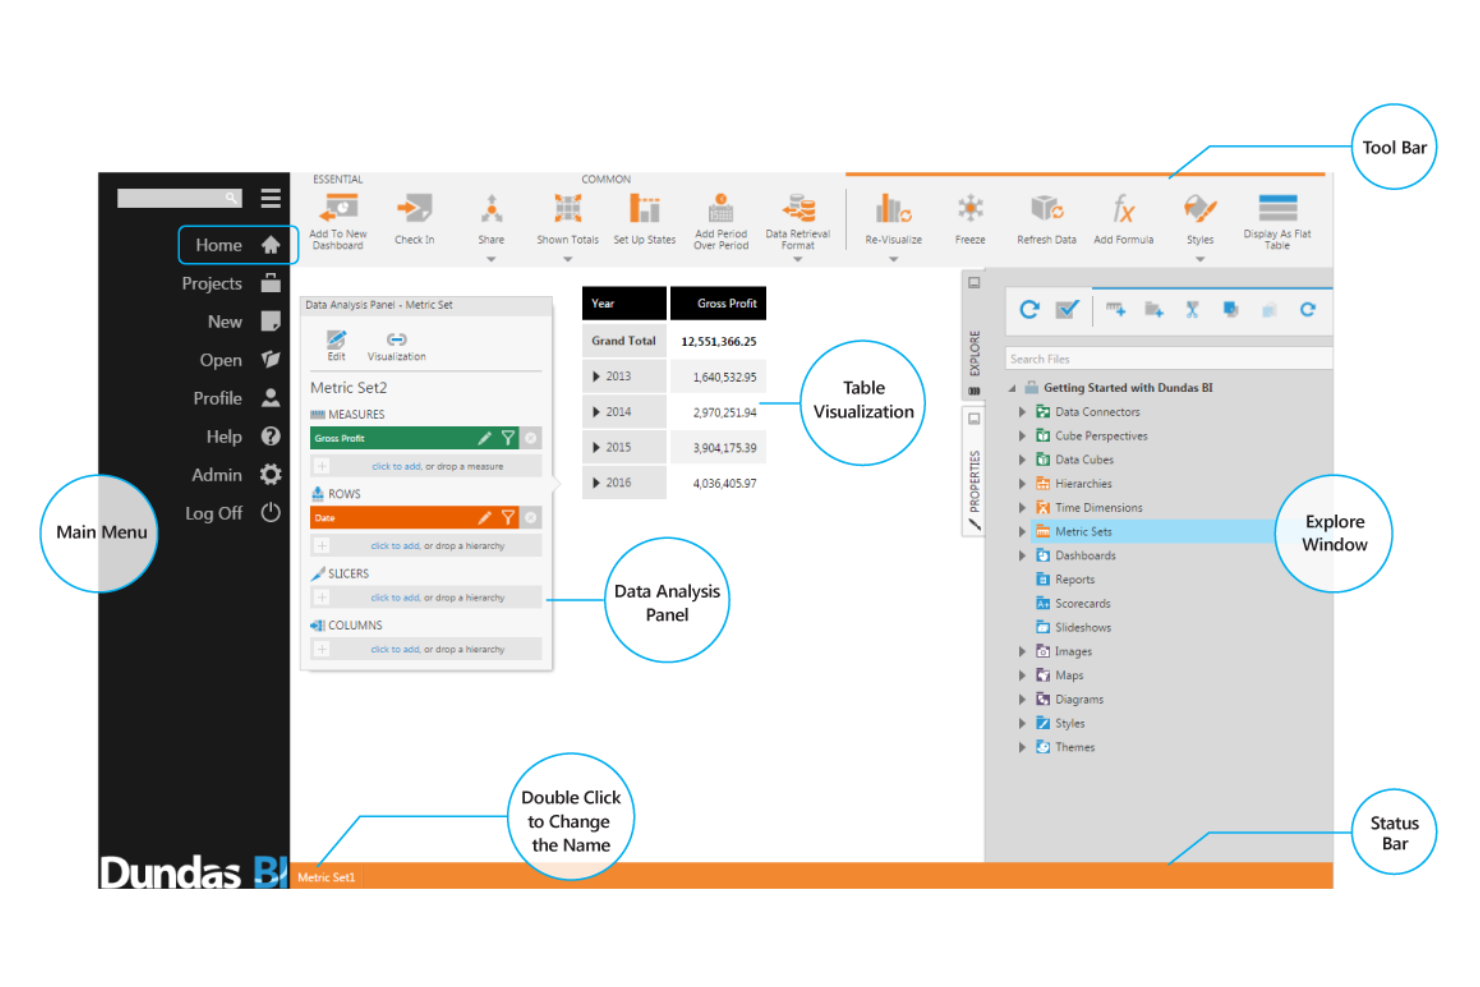
Dundas BI is a flexible, embeddable BI platform for creating customizable dashboards, reports, and data visualizations. It allows you to analyze data, monitor KPIs, and make decisions with real-time insights.
Why Dundas BI is a good Tableau alternative: Dundas BI offers programmable, white-label analytics that enable you to tailor dashboards and reports to meet specific business needs. With its extensive data connectivity, you can integrate various data sources into a single platform.
Standout Features and Integrations:
Features include an intuitive drag-and-drop interface and a wide array of advanced, interactive data visualizations that allow for deep customization, helping you present complex data effectively. The platform's built-in ETL capabilities make data transformation and loading straightforward. Advanced data analytics help you move from raw data to actionable insights for detailed analysis.
Integrations are not publicly listed.
Pros and Cons
Pros:
- Extensive data connectivity
- Advanced data prep and in-memory performance
- Highly flexible, open, and programmable
Cons:
- Limited pre-built dashboard templates
- Requires developer involvement for customization
Yellowfin is a BI and analytics platform for data analysts and business managers across various industries. Its focus is on automated insights, data storytelling, and embedded analytics.
Why Yellowfin is a good Tableau alternative: Yellowfin excels as an embedded BI platform, making it an ideal choice for businesses looking to integrate analytics into their existing applications. Its action-based dashboards turn data into compelling narratives that drive decision-making. The suite's self-service and AI capabilities allow your team to explore data without requiring significant technical skills.
Standout Features and Integrations:
Features include data storytelling, which enables you to build narratives and helps bridge the gap between data presentation and business context. The platform's real-time monitoring alerts you to important changes as they happen. AI-driven insights offer automated analysis, saving you time on data exploration.
Integrations include Salesforce, Microsoft Excel, Google Analytics, Oracle, and more.
Pros and Cons
Pros:
- Makes predictive analytics accessible
- Automated insights and monitoring
- Actionable dashboards
Cons:
- High upfront effort
- Basic built-in ETL functionality
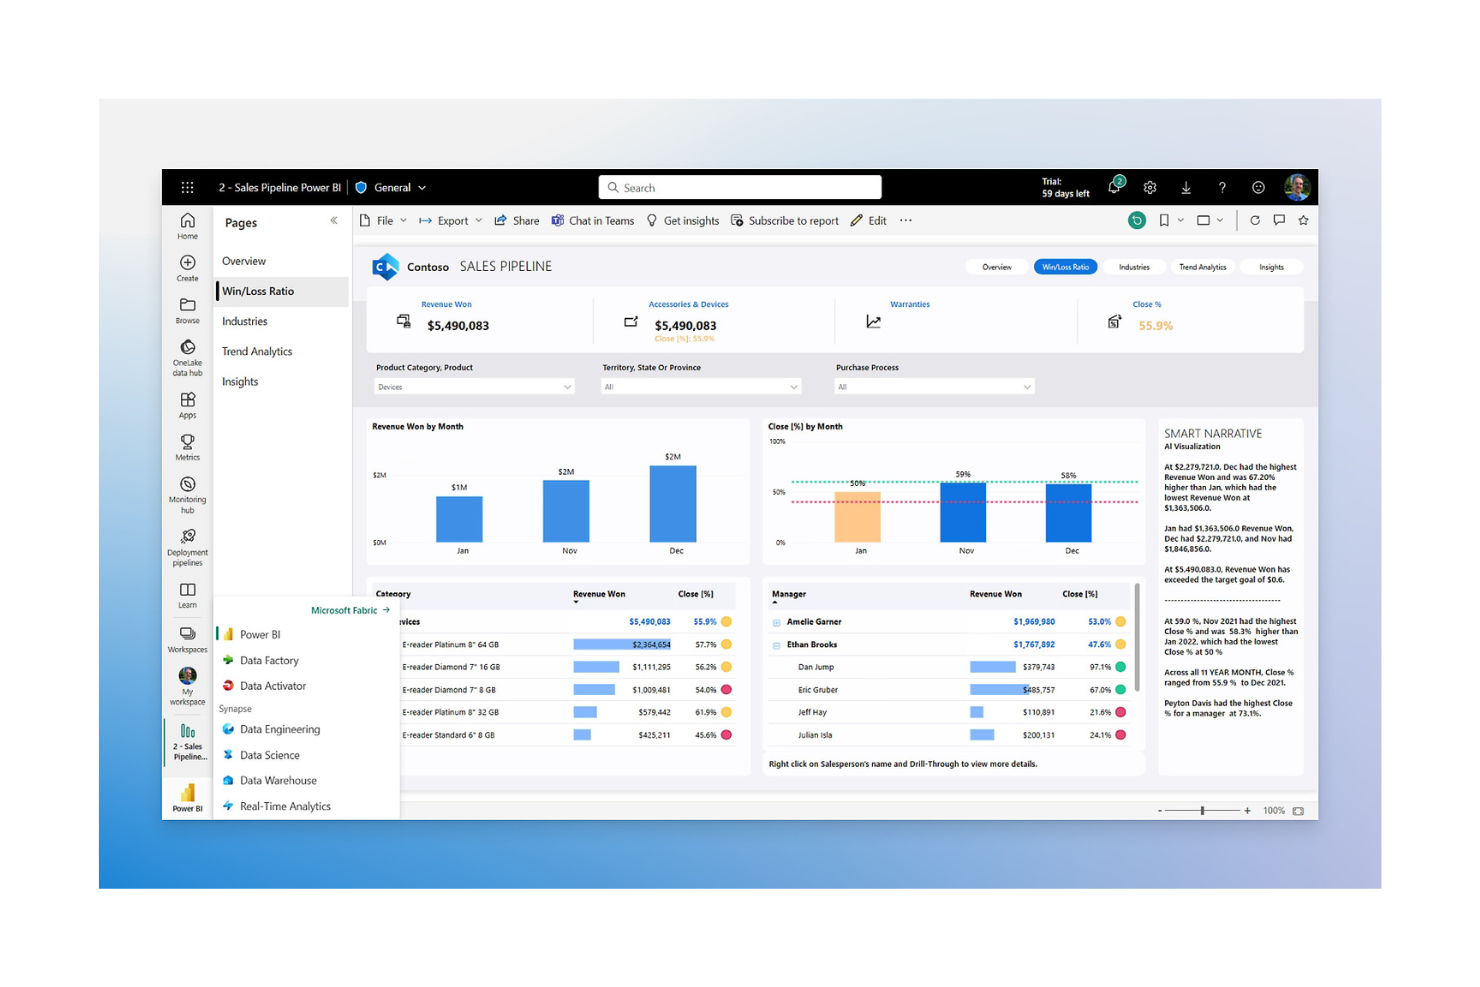
Microsoft Power BI is a data visualization and business intelligence tool for data analysts and business professionals. It optimizes workflows by transforming complex data into actionable insights through visualization, automation, and process analysis.
Why Power BI is a good Tableau alternative: Power BI offers native integration with the Microsoft ecosystem, which is a major advantage if your team already uses these products. It supports Python scripts for data transformation and custom visuals, and its connectivity with tools such as Excel and Azure optimizes data accessibility and collaboration. Power BI's user-friendly interface makes it easy to create and share reports across your organization.
Standout Features and Integrations:
Features include extensive tools to automate data analysis, providing AI-driven insights with minimal manual effort. The drag-and-drop interface simplifies report creation, making it accessible for users with varying technical skills. Real-time data updates ensure you have the most current information at hand.
Integrations include Microsoft Excel, Microsoft Azure, Microsoft Dynamics 365, SharePoint, and more.
Pros and Cons
Pros:
- Connects directly to AWS data sources
- Strong native machine learning and AI capabilities
- Deep Microsoft integration
Cons:
- Complex data modeling
- Data restrictions on lower-tier plans
Spider Strategies offers BI tools through its flagship product, Spider Strategies. While it focuses on strategy execution and business improvement, the platform's operational features enable you to analyze, visualize, and act on data, thereby refining performance management and reporting.
Why Spider Strategies is a good Tableau alternative: Spider Strategies specializes in bridging the gap between strategic planning and operational execution, helping your organization achieve its goals. Spider Strategies' focus on data-driven KPIs ensures you can measure success effectively.
Standout Features and Integrations:
Features include dynamic, interactive dashboards that deliver real-time performance insights. Advanced analytics and AI-powered tools help you identify operational patterns, forecast trends, and make informed decisions. You can also create data-driven KPIs to track progress and adapt strategies as needed.
Integrations include Microsoft Excel, Google Sheets, Oracle, SAP, Salesforce, Amazon Web Services, Microsoft Azure, and more.
Pros and Cons
Pros:
- Plain language AI insights
- Automated KPI and data management
- Built-in predictive analytics
Cons:
- Time-intensive setup and configuration
- Manual calculation import limitation
Other Tableau Alternatives
Here are some additional Tableau alternatives that didn’t make it onto my shortlist but are still worth checking out:
- Logi Symphony
For AI-powered, user-centric customization
- Zoho Analytics
For privacy-focused analytics
- Looker
For AI-led Google Cloud integration
- Domo
For real-time data visualization


Tableau Alternatives Selection Criteria
When selecting the best Tableau alternatives to include in this list, I considered common buyer needs and pain points related to business intelligence software, such as data integration capabilities and ease of use. I also used the following framework to keep my evaluation structured and fair:
Core Functionality (25% of total score)
To be considered for inclusion in this list, each solution had to fulfill these common use cases:
- Data visualization
- Dashboard creation
- Reporting
- Data analysis
- Data integration
Additional Standout Features (25% of total score)
To help further narrow down the competition, I also looked for unique features, such as:
- AI-driven insights
- Real-time data processing
- Customizable dashboards
- Embedded analytics
- Natural language processing
Usability (10% of total score)
To get a sense of the usability of each system, I considered the following:
- Intuitive interface
- Ease of navigation
- Customization options
- Speed of data processing
- Learning curve
Onboarding (10% of total score)
To evaluate the onboarding experience for each platform, I considered the following:
- Availability of training videos
- Interactive product tours
- Pre-built templates
- Webinars and tutorials
- Accessible documentation
Customer Support (10% of total score)
To assess each software provider's customer support services, I considered the following:
- 24/7 availability
- Response time
- Help center resources
- Personalized support
- Community forums
Value for Money (10% of total score)
To evaluate the value for money of each platform, I considered the following:
- Pricing transparency
- Feature set relative to cost
- Scalability of pricing plans
- Cost of add-ons
- Free trial availability
Customer Reviews (10% of total score)
To get a sense of overall customer satisfaction, I considered the following when reading customer reviews:
- Overall satisfaction rating
- Feedback on features
- Comments on customer support
- Usability experiences
- Return on investment insights
Why Look for a Tableau Alternative?
While Tableau is a good choice for BI software, there are several reasons why some users seek out alternative solutions. You might be looking for a Tableau alternative because:
- You need a more budget-friendly option
- Your team requires easier data integration
- You want a simpler user interface for non-tech users
- You need better geographic availability
- Your team requires a faster data processing speed
- You want more customizable dashboard options
If any of these sound like you, you've come to the right place. My list includes several BI software options that are particularly suitable for teams facing these challenges with Tableau and looking for alternative solutions.Tableau’s core features are well documented and widely used across analytics teams, making it a strong benchmark for comparison.
Tableau Key Features
Here are some of the key features of Tableau, to help you contrast and compare what alternative solutions offer:
- Data visualization: Allows you to create interactive and shareable dashboards for visual data analysis.
- Dashboard creation: Enables the creation of detailed and customizable dashboards for data presentation.
- Data blending: Combines data from multiple sources to provide a unified view for analysis.
- Collaboration: Ensures your team can share dashboards and collaborate on data insights effectively.
- Real-time data analysis: Provides up-to-the-minute data analysis to support timely decision-making.
- Mobile support: Features mobile-friendly dashboards and reports for on-the-go access.
- Advanced analytics: Includes features such as forecasting and trend analysis to optimize data insights.
- Data connectivity: Connects to a wide range of data sources to pull in diverse datasets.
- Augmented analytics: Use AI to provide deeper insights and automate data analysis tasks.
- Security: Ensures data security and user access controls to protect sensitive information.
What's Next:
If you're in the process of researching business intelligence software, connect with a SoftwareSelect advisor for free recommendations.
You fill out a form and have a quick chat where they get into the specifics of your needs. Then you'll get a shortlist of software to review. They'll even support you through the entire buying process, including price negotiations.