

I 10 migliori software di analisi statistica recensiti nel 2026

10 Elenco dei migliori software per l'analisi statistica


In qualità di CFO, ti trovi costantemente a gestire numeri, previsioni e report. Non è un segreto che gestire grandi quantità di dati possa essere complicato. È qui che entra in gioco il software per l'analisi statistica, aiutandoti a dare un senso al caos.
Nella mia esperienza, questi strumenti offrono chiarezza e precisione, trasformando i dati grezzi in informazioni utili. Possono trasformare il tuo processo decisionale, fornendo un valido supporto al tuo team finanziario.
In questo articolo condividerò le mie migliori scelte tra i software per l'analisi statistica. Troverai recensioni imparziali e approfondite, pensate per aiutarti a scegliere lo strumento più adatto alle tue esigenze. Esaminiamo le opzioni che possono aiutarti a sfruttare al meglio i tuoi dati finanziari.
Perché fidarsi dei nostri consigli sui software
Le nostre recensioni riflettono il nostro giudizio indipendente, non un discorso di vendita. Scopri come manteniamo la trasparenza.
Per questa guida, abbiamo valutato gli strumenti attraverso test pratici e ricerche indipendenti, assegnando un punteggio agli strumenti in base ai nostri criteri di selezione.
Le nostre recensioni riflettono il nostro giudizio editoriale umano, non un discorso di vendita.
Riepilogo dei migliori software per l'analisi statistica
Questa tabella comparativa riassume i dettagli dei prezzi delle mie migliori selezioni di software per l’analisi statistica, per aiutarti a trovare quello più adatto al tuo budget e alle esigenze della tua azienda.
| Tool | Best For | Trial Info | Price | ||
|---|---|---|---|---|---|
| 1 | Ideale per utenti Salesforce | Prova gratuita disponibile | Da $70/utente/mese | Website | |
| 2 | Ideale per grandi team con competenze diverse | Prova gratuita disponibile | Da $99/utente/mese | Website | |
| 3 | Ideale per la pulizia di grandi volumi di dati | Prova gratuita disponibile | Da $940/anno | Website | |
| 4 | Le migliori dashboard | Prova gratuita disponibile | Prezzo su richiesta | Website | |
| 5 | Ideale per utenti di Microsoft Excel | Prova gratuita di 14 giorni | A partire da $345/anno | Website | |
| 6 | Miglior strumento cross-dipartimentale | Prova gratuita di 14 giorni | A partire da $0.55/SU/ora | Website | |
| 7 | Ideale per la programmazione avanzata | Not available | Da $840/anno | Website | |
| 8 | Miglior software open source per l'analisi statistica | Not available | Gratuito | Website | |
| 9 | Ideale per utenti Mac | Prova gratuita disponibile | Prezzo su richiesta | Website | |
| 10 | Ideale per la creazione di grafici | Prova gratuita disponibile | Da $465/anno | Website |
Recensioni dei migliori software per l'analisi statistica
Di seguito trovi i miei riepiloghi dettagliati dei migliori software per l’analisi statistica inclusi nel mio elenco ristretto. Le mie recensioni offrono una panoramica dettagliata delle caratteristiche principali, dei pro e dei contro, delle integrazioni e dei casi d’uso ideali di ogni strumento, per aiutarti a trovare quello più adatto a te.

Tableau
Ideale per utenti Salesforce
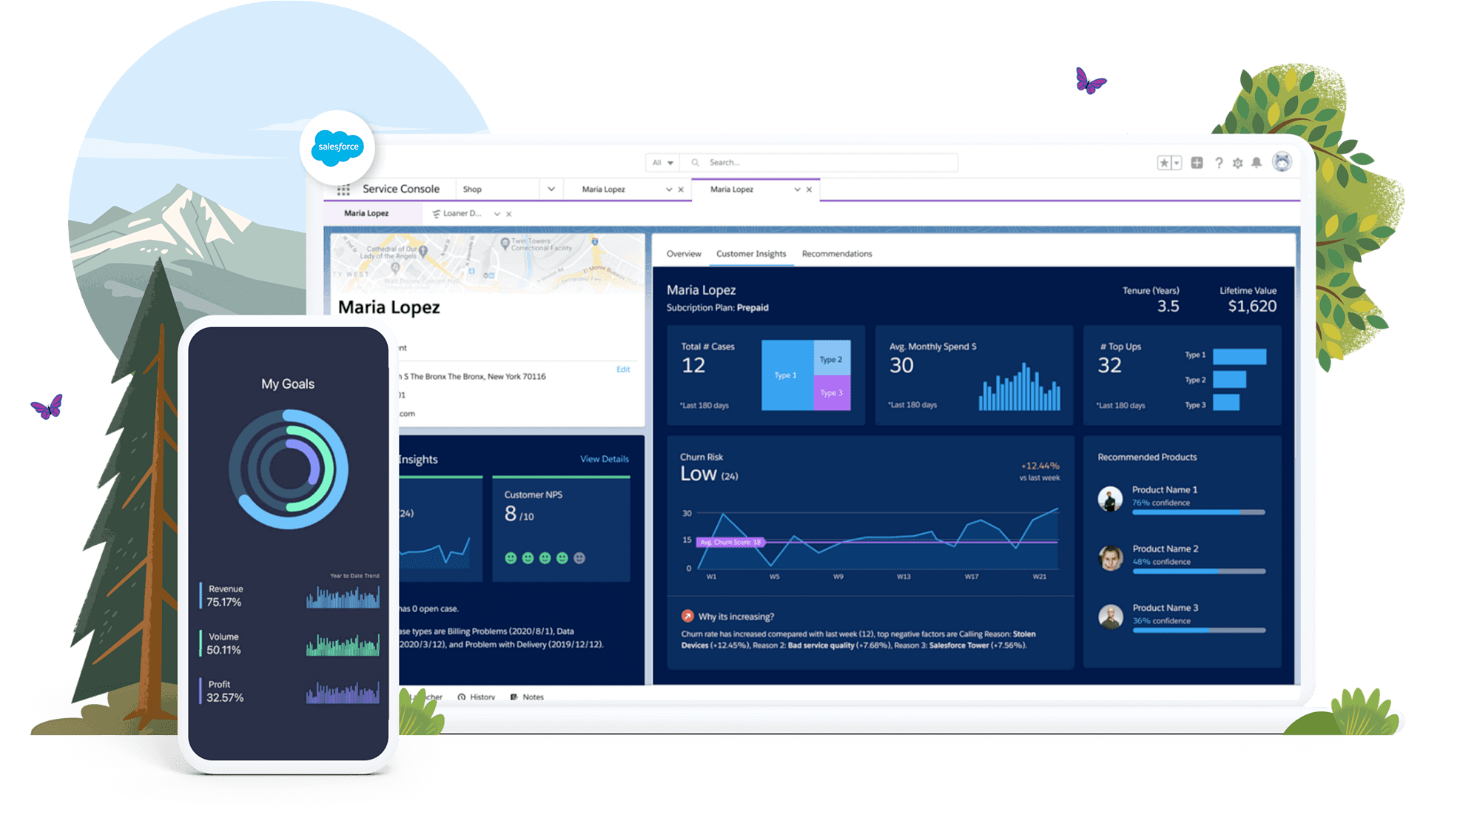
Tableau è la piattaforma di analisi visiva di Salesforce. Puoi implementarla sui tuoi server, nel cloud o integrarla nativamente con il tuo CRM Salesforce — perfetto se hai intenzione di analizzare dati dei clienti.
Perché ho scelto Tableau: L'integrazione nativa di Tableau con Salesforce è un importante punto di forza per qualsiasi azienda che già utilizza il CRM dell'azienda. È praticamente l'unico software di analisi statistica con questo tipo di integrazione. Naturalmente, puoi collegare quasi qualsiasi altra fonte di dati alla piattaforma. Il software è anche alimentato dall'Einstein AI di Salesforce, che ti permette di usare lo strumento per effettuare previsioni basate sull'intelligenza artificiale a partire dai tuoi dati.
Funzionalità di spicco e integrazioni:
Le funzionalità includono la mappatura dei dati tramite accelerator, che semplifica la configurazione delle dashboard consentendo una facile mappatura dei dati esterni. Il tuo team può beneficiare di titoli degli assi dinamici, che permettono di aggiornare i titoli degli assi in base ai valori dei parametri. Inoltre, i miglioramenti di Tableau Prep ottimizzano la connessione ai dati e l'usabilità, rendendo il processo di preparazione dei dati più fluido.
Le integrazioni includono Salesforce, Microsoft Excel, Google Sheets, Amazon Redshift, Snowflake, Google BigQuery, SAP Hana, SQL Server e IBM DB2.
Pros and Cons
Pros:
- Integrazione nativa con Salesforce
- Ampia gamma di integrazioni di terze parti
- Dashboard intuitiva con funzionalità drag-and-drop
Cons:
- Le funzionalità di visualizzazione potrebbero essere migliorate
- Il download di grandi set di dati può richiedere tempo

IBM SPSS
Ideale per grandi team con competenze diverse
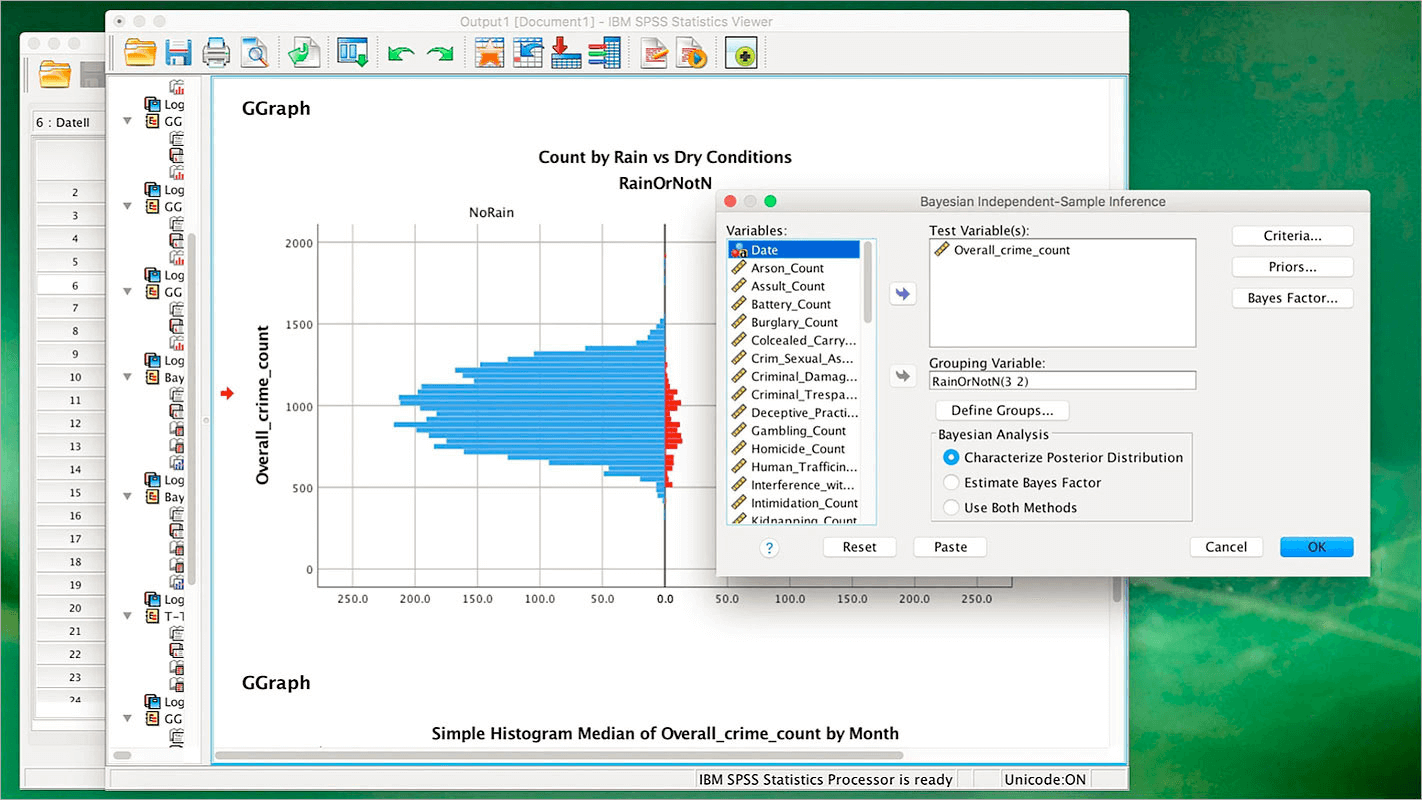
IBM SPSS è una piattaforma di software statistico con un'interfaccia intuitiva che consente agli utenti di preparare e analizzare dati senza conoscere la programmazione. Lo strumento utilizza una funzionalità di trascinamento per effettuare analisi e offre una serie di demo tecniche per aiutarti a iniziare.
Perché ho scelto IBM SPSS: Alcune piattaforme di software statistico possono confondere gli utenti con una miriade di funzionalità. Altre, invece, limitano le capacità per attrarre un pubblico di principianti. Ma IBM SPSS riesce a trovare un equilibrio tra le due cose, posizionandosi come opzione intuitiva pur offrendo una gamma completa di funzionalità avanzate (come le analisi di regressione). Questo rende facile per gli analisti inesperti prendere confidenza con la piattaforma senza doversi poi spostare su un'altra soluzione una volta acquisita maggiore competenza.
Funzionalità e integrazioni principali:
Funzionalità includono un'interfaccia pulita e facile da usare e la funzionalità drag-and-drop. Tutto quello che gli utenti devono fare è puntare e cliccare sul modello desiderato per eseguire un'analisi sui propri dati. È inoltre disponibile un'ampia gamma di modelli statistici tra cui scegliere, dalle funzioni di base come la modellizzazione delle frequenze fino alla modellizzazione di regressione avanzata, e la piattaforma automatizza anche gran parte del processo di preparazione dei dati.
Integrazioni includono TIMi e JMP, Voxco Online e Rotator Survey.
Pros and Cons
Pros:
- Interfaccia utente eccellente
- Ampia gamma di modelli statistici
- Prezzo competitivo
Cons:
- Mancano alcuni modelli molto avanzati
- Le funzionalità di reportistica sono poco flessibili

MATLAB
Ideale per la pulizia di grandi volumi di dati
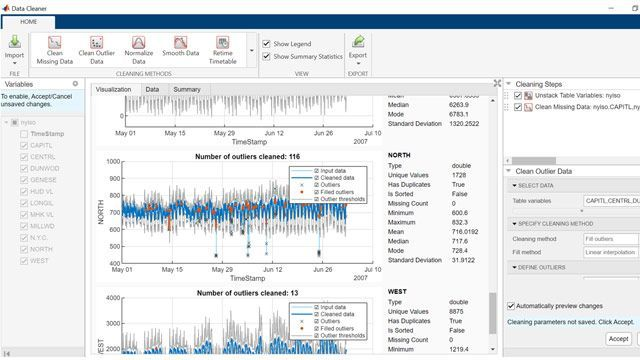
MATLAB è un software di analisi statistica per la pulizia, l’analisi e la visualizzazione dei dati. L’editor live della piattaforma permette di svolgere in modo interattivo attività iterative come la pulizia e l’etichettatura dei dati.
Perché ho scelto MATLAB: Dati disordinati possono compromettere i risultati. Ecco perché MATLAB è adatto a qualsiasi CFO che dispone di un ampio set di dati e desidera pulirli ed etichettarli prima di un’analisi approfondita. Non lasciarti influenzare dal fatto che lo strumento è utilizzato principalmente in ambito accademico: è molto utile anche per analizzare dati aziendali e generare report significativi.
Funzionalità principali & integrazioni:
Funzionalità includono strumenti integrati per il calcolo numerico, che permettono di analizzare i dati e creare algoritmi. È possibile visualizzare il proprio lavoro tramite grafici e diagrammi personalizzabili, che aiutano a individuare chiaramente i pattern. MATLAB permette anche di scrivere script e funzioni per automatizzare i compiti e aumentare l’efficienza.
Integrazioni includono Simulink, Excel, Python, C++, Java, Fortran, Amazon Web Services, Google Cloud, ThingSpeak e Arduino.
Pros and Cons
Pros:
- Strumenti multipli per la pulizia dei dati
- Interfaccia grafica intuitiva
- Creazione di visual personalizzate
Cons:
- Richiede molta potenza di calcolo per funzionare
- Curva di apprendimento ripida

Domo
Le migliori dashboard
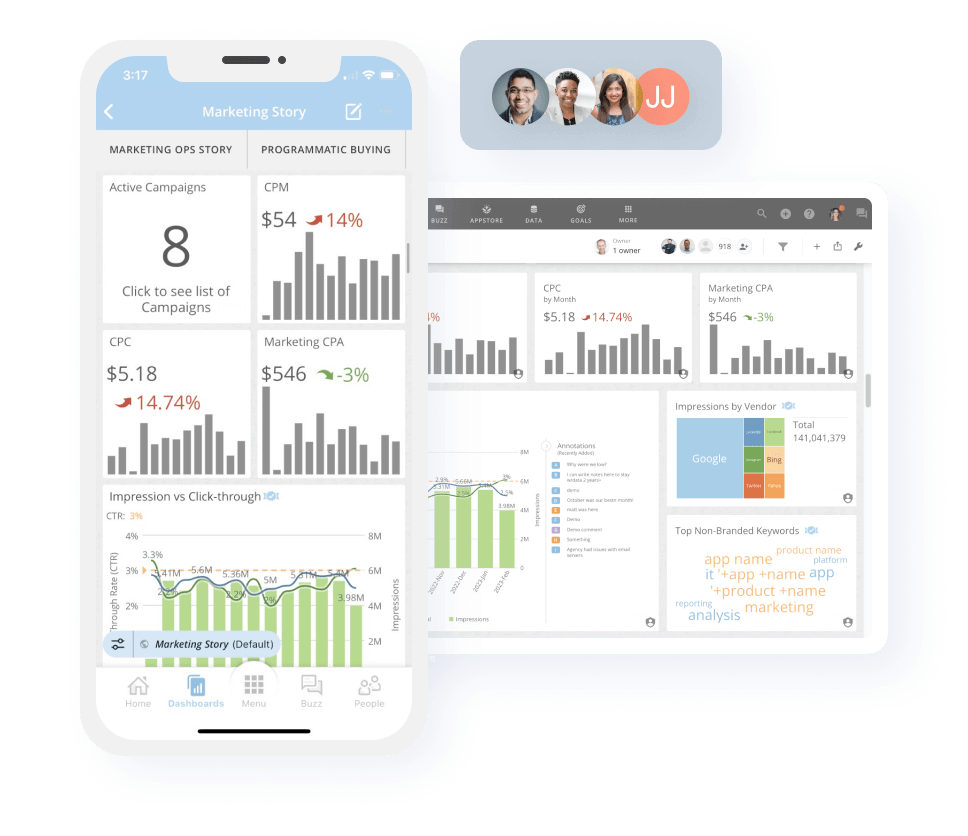
Domo è una piattaforma dati basata su cloud progettata per aiutare tutti all'interno della tua organizzazione a utilizzare meglio i dati aziendali. Le dashboard intuitive e i report del software rendono semplice, anche per gli analisti alle prime armi, generare insight e sfruttare i dati.
Perché ho scelto Domo: Tra tutti i software di analisi statistica presenti in questo elenco, Domo è probabilmente il più facile da usare. Il software automatizza l'estrazione dei dati, permettendo così di trasferire i dati dai fogli di calcolo alle dashboard in tempo reale, mentre le sue analisi incorporate consentono persino di condividere le dashboard esternamente con clienti o partner.
Caratteristiche principali & integrazioni:
Caratteristiche includono strumenti di analisi dati facili da usare che rendono semplice, per te e il tuo team, approfondire l'analisi dei dati, indipendentemente dal livello di competenza. Il software offre tecniche avanzate di regressione per aiutarti a ottenere insight predittivi e prendere decisioni informate. Inoltre, IBM SPSS offre solide capacità di gestione dei dati, assicurando che i tuoi dati siano organizzati e accessibili per l'analisi.
Integrazioni includono connessioni native con IBM Cognos Analytics, Microsoft Excel, R, Python, IBM Watson Studio, Hadoop, Apache Spark, Amazon Web Services, Google Cloud e Microsoft Azure.
Pros and Cons
Pros:
- Dashboard e report personalizzabili
- Feed di dati in tempo reale
- Ottima interfaccia utente
Cons:
- Manca funzionalità avanzate
- Assistenza clienti carente

XLSTAT
Ideale per utenti di Microsoft Excel
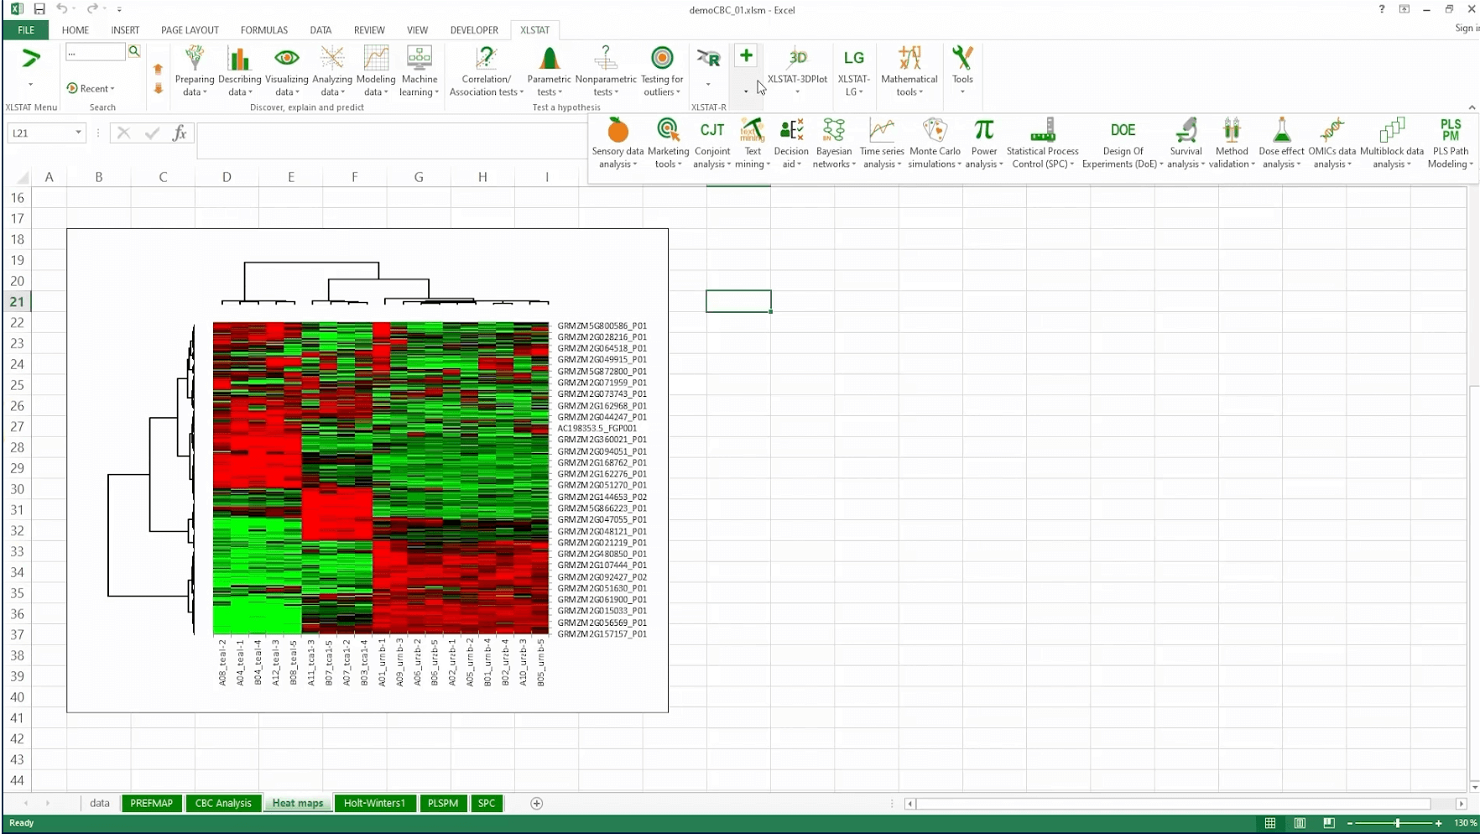
XLSTAT è una delle principali soluzioni software per l’analisi statistica progettata specificamente per Microsoft Excel. Si integra nativamente nel foglio di calcolo, permettendo di analizzare i dati aziendali senza lasciare la piattaforma.
Perché ho scelto XLSTAT: Se l'integrazione nativa con Microsoft Excel non fosse sufficiente, gli analisti aziendali e i CFO possono utilizzare XLSTAT senza dover conoscere alcun linguaggio di programmazione. È possibile generare report approfonditi e grafici Excel personalizzabili, replicando molte delle capacità offerte anche da altre piattaforme in questo elenco.
Caratteristiche e integrazioni principali:
Funzionalità include una suite avanzata di oltre 250 strumenti per l’analisi dei dati. Il software offre anche strumenti avanzati di machine learning, consentendo al tuo team di integrare script R per solide attività di regressione e classificazione.
Integrazioni includono Microsoft Excel, Word e PowerPoint.
Pros and Cons
Pros:
- Integrazione nativa con Excel
- Assistenza clienti eccellente
- Facile da usare
Cons:
- Il prezzo della versione premium può risultare elevato
- Può essere difficile da usare per i principianti

SAS Viya
Miglior strumento cross-dipartimentale

SAS Viya è una piattaforma cloud per l'IA, l'analisi e la gestione dei dati. Puoi integrare dati da quasi qualsiasi fonte ed eseguire funzionalità collaborative di preparazione e analisi dei dati come team.
Perché ho scelto SAS Viya: La collaborazione è al centro della piattaforma SAS Viya. Con questo strumento, le aziende possono creare uno spazio condiviso in cui chiunque faccia parte del team dati può lavorare insieme all’analisi. Ad esempio, gli ingegneri dei dati possono creare pipeline scalabili, i data scientist possono trasformare tali set di dati in dati strutturati e gli analisti aziendali possono utilizzare strumenti avanzati di analisi per ricavare informazioni.
Funzionalità e integrazioni principali:
Funzionalità comprendono capacità di machine learning che consentono di ottenere insight da grandi quantità di dati con facilità. L'interfaccia interattiva permette anche al tuo team di esplorare visivamente i dati, migliorando la collaborazione e il processo decisionale.
Integrazioni includono Microsoft Azure, Amazon Web Services, Google Cloud, Microsoft Office, Hadoop, SAP, Salesforce, IBM e Teradata.
Pros and Cons
Pros:
- Ottime funzionalità collaborative
- Facile collegamento a diverse fonti dati
- Elaborazione molto veloce
Cons:
- Può risultare costosa in base all'utilizzo
- La piattaforma non è tra le più intuitive

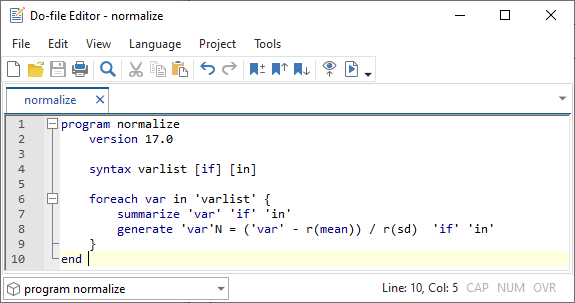
Stata è un pacchetto software avanzato che copre tutta la gamma delle analisi statistiche, dalla preparazione e manipolazione dei dati fino alla visualizzazione e alla reportistica automatizzata. Il programma include Mata, un linguaggio di programmazione avanzato che aggiunge supporto diretto per la programmazione matriciale.
Perché ho scelto Stata: Anche se non è necessario programmare per utilizzare Stata, il linguaggio incorporato della piattaforma offre agli utenti esperti un ambiente di sviluppo in cui possono produrre e compilare codice. Lo strumento offre anche PyStata, un'integrazione con Python che consente di integrare Python direttamente nel proprio codice.
Caratteristiche e integrazioni principali:
Caratteristiche includono modelli statistici avanzati adatti a una vasta gamma di discipline, offrendo al tuo team gli strumenti per analisi di dati sia semplici che complesse. Puoi esplorare i dati con funzionalità grafiche avanzate, rendendo più facile visualizzare tendenze e schemi. Inoltre, Stata supporta la media bayesiana dei modelli e l'analisi causale di mediazione, utili per interpretazioni statistiche più sofisticate.
Integrazioni includono Python, R, Excel, SAS, SPSS, MATLAB, SQL Server, PostgreSQL e MySQL.
Pros and Cons
Pros:
- Ampio supporto per linguaggi di programmazione
- Aggiornamenti regolari
- Supporto eccezionale
Cons:
- Curva di apprendimento ripida
- Meno adatto ai principianti rispetto ad altri strumenti


Scilab è un software gratuito e open source per l'analisi statistica distribuito sotto licenza GPL. Questo significa che puoi utilizzare il software per qualsiasi scopo, modificarlo e condividerlo con i colleghi.
Perché ho scelto Scilab: Scilab è l'unico software per l'analisi statistica in questo elenco che puoi utilizzare gratuitamente a lungo termine. Ma questo non significa che il software sia carente di funzionalità. Offre infatti molti degli strumenti e delle funzioni di analisi dei dati di cui hai bisogno, inclusa l'analisi numerica, la visualizzazione dei dati e le simulazioni.
Funzionalità e integrazioni principali:
Funzionalità comprendono un'interfaccia facile da usare che consente di gestire calcoli e simulazioni complesse con facilità. Scilab offre un vasto insieme di funzioni matematiche per supportare le tue necessità computazionali, aiutando il tuo team nell'affrontare compiti che vanno dall'aritmetica di base al calcolo avanzato. Inoltre, la sua natura open source garantisce che tu possa personalizzare ed espandere il software in base alle tue esigenze specifiche.
Integrazioni includono MATLAB, LabVIEW, C++, Java, Python, Fortran, COMEDI e Xcos.
Pros and Cons
Pros:
- Gratuito da usare e modificare
- Interfaccia pulita
- Elaborazione veloce
Cons:
- Manca di funzionalità rispetto ai prodotti premium
- Non molto intuitivo da usare


JMP è un software statistico desktop progettato per adattarsi a tutti i livelli di analisi, dagli ingegneri agli analisti aziendali fino agli scienziati. Come ci si aspetta da qualsiasi prodotto Mac, presenta un'interfaccia utente pulita che rende facile per chiunque iniziare a utilizzare lo strumento.
Perché ho scelto JMP: Il client nativo per macOS è un elemento di grande valore, considerando che non tutti i software di analisi statistica desktop funzionano su questo sistema operativo. Tuttavia, JMP non è limitato a causa di ciò. Offre comunque tutti gli strumenti necessari per comprendere i dati aziendali, tramite una soluzione senza codice.
Funzionalità e integrazioni distintive:
Funzionalità includono strumenti dinamici di visualizzazione dei dati che permettono di esplorare rapidamente tendenze e modelli nei dati. Il tuo team può utilizzare anche la modellazione statistica integrata per ottenere informazioni dettagliate senza dover possedere competenze avanzate di programmazione. Nella mia esperienza, i dashboard interattivi facilitano la condivisione delle scoperte e una collaborazione efficace.
Integrazioni includono Excel, R, Python, SAS, MATLAB, Minitab, Tableau, JMP Live, SQL Server e Oracle NetSuite.
Pros and Cons
Pros:
- Client Mac nativo disponibile
- Ottime capacità di dashboarding
- Ampia gamma di grafici
Cons:
- Può avere una curva di apprendimento lunga
- La correzione di errori e bug può richiedere tempo

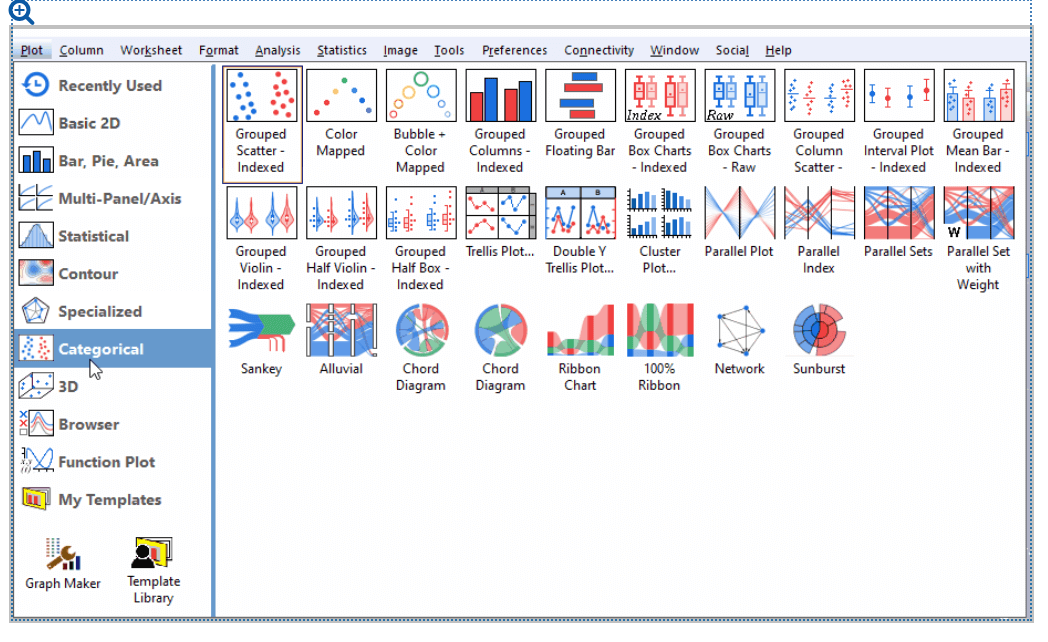
OriginPro è uno strumento di analisi dei dati e creazione di grafici scientifici utilizzato da oltre mezzo milione di ingegneri e scienziati per creare rappresentazioni visive dei dati senza la necessità di programmare.
Perché ho scelto OriginPro: Se desideri rappresentare visivamente i dati, ci sono poche opzioni migliori di OriginPro. Il software offre oltre 100 tipologie di grafici predefinite e consente la personalizzazione di ogni elemento con un semplice clic. È anche possibile salvare i grafici personalizzati come nuovi modelli, così da non doverli ricreare da zero nei report successivi.
Funzionalità e integrazioni principali:
Funzionalità comprendono un'organizzazione intuitiva dei dati tramite un'interfaccia in stile foglio di calcolo che mantiene il lavoro ordinato e accessibile. È possibile creare facilmente grafici multipannello per confrontare i set di dati fianco a fianco. Il software offre inoltre strumenti per l'elaborazione in batch, risparmiando tempo nelle attività ripetitive.
Integrazioni disponibili con MATLAB, Excel, Python, LabVIEW, LabTalk, SQL Server, R, MySQL, Origin C e COM.
Pros and Cons
Pros:
- Eccellente analisi grafica
- Interfaccia intuitiva
- Ottimo team di supporto
Cons:
- Il programma a volte va in crash
- Sezione di aiuto carente
Altri software per l'analisi statistica
Ecco alcune opzioni aggiuntive di software per l’analisi statistica che non sono state incluse nel mio elenco ristretto, ma che vale comunque la pena valutare:
- NCSS
Ideale per la navigazione dei risultati
- GraphPad Prism
Ideale per la ricerca scientifica
- SUDAAN
Ideale per l'analisi di studi complessi


Come Valuto i Software di Analisi Statistica
Quando un analista del rischio deve eseguire simulazioni Monte Carlo o un team FP&A ha bisogno di previsioni basate su ARIMA, prima di tutto valuto la profondità statistica di base, poi considero i fattori distintivi che differenziano gli strumenti.
Funzionalità di Base (Requisiti Minimi per questa Lista)
Quando seleziono gli strumenti per il mio elenco, valuto ciascuno su una scala da 0 (non offre la funzionalità) a 5 (eccelle in quest'area) per ogni funzionalità di base elencata di seguito. Successivamente, trasformo il punteggio totale dello strumento in una percentuale. Ogni strumento deve raggiungere un punteggio totale minimo del 65% per essere preso in considerazione per l'inclusione.
- Statistiche Descrittive & Inferenziali: Verifico se uno strumento copre l'intera gamma di test parametrici e non parametrici, dai semplici test t per l'analisi della varianza ai test chi-quadrato per dati di audit categoriali.
- Regressione & Modellizzazione Econometrica: Che si tratti di costruire un modello di ricavo multivariato o di adattare un modello GARCH ai dati di volatilità, valuto la profondità e la varietà dei metodi di regressione disponibili.
- Previsioni di Serie Storiche: Cerco funzionalità ARIMA, smoothing esponenziale e decomposizione stagionale che permettano ai team FP&A di proiettare il flusso di cassa o modellare andamenti ciclici nei dati finanziari.
- Monte Carlo & Simulazione: Gli analisti del rischio devono effettuare stress test sui portafogli e modellare l'incertezza nelle proiezioni, quindi valuto come ogni strumento gestisce la simulazione probabilistica e l'analisi di sensitività.
- Importazione Dati & Integrazione Finanziaria: Lo strumento dovrebbe connettersi alle fonti dati che i team finanziari realmente usano, come i file Excel, database SQL, e piattaforme ERP come SAP o NetSuite.
- Reportistica & Visualizzazione: Cerco grafici statistici, formati di report esportabili e visualizzazioni pronte per le presentazioni utili a illustrare i risultati agli stakeholder durante riunioni di consiglio o del comitato di audit.
Una volta ottenuta la lista degli strumenti che soddisfano i criteri, considero ciò che distingue ogni piattaforma.
Fattori Differenzianti (Cosa Distingue i Fornitori)
Ecco come confronto e metto a confronto i diversi fornitori:
Caratteristiche Distintive
La creazione di modelli senza codice è un fattore importante—cerco interfacce a menu o drag-and-drop che consentano agli analisti FP&A di eseguire regressioni senza scrivere codice. Dall'altro lato, il supporto allo scripting per R o Python è rilevante quando i team quantitativi devono automatizzare modelli ricorrenti. Per i flussi di lavoro di accounting forense, analisi integrate della Legge di Benford e metodi automatizzati di campionamento per audit fanno risparmiare settimane di lavoro manuale. Valuto anche gli spazi di lavoro collaborativi con controllo di versione e tracciabilità delle modifiche, elementi essenziali quando più analisti contribuiscono alla stessa revisione finanziaria.
Oltre le Caratteristiche
La sicurezza dei dati è fondamentale quando si trattano set di dati finanziari, quindi verifico la certificazione SOC 2 Type II e gli standard di crittografia prima di procedere. Anche l'integrazione con l'ecosistema tecnologico finanziario più ampio è importante: strumenti che si connettono nativamente a sistemi ERP, piattaforme BI e fornitori di dati di mercato eliminano ore di preparazione manuale dei dati. Analizzo inoltre la flessibilità di implementazione, poiché alcuni team finanziari richiedono installazioni on-premise per soddisfare le politiche IT interne. Infine, risorse di formazione fornite dal fornitore, con esempi specifici per la finanza, aiutano i team a diventare operativi più rapidamente dopo l'implementazione.
Come scegliere un software per l'analisi statistica
Scegliere un software per l'analisi statistica può diventare rapidamente complicato. Per questo ho preparato questa semplice lista di controllo, che ti aiuterà a confrontare gli strumenti, individuare le funzionalità indispensabili e sentirti sicuro della tua decisione. Usala per mantenere la ricerca mirata ed efficiente.
| Fattore | Cosa considerare |
|---|---|
| Scalabilità | Assicurati che il software sia in grado di gestire la crescita dei tuoi dati. Cerca soluzioni che si adattino alle tue esigenze senza perdita di prestazioni. |
| Integrazioni | Verifica se si integra con gli strumenti che già utilizzi, come altri software di contabilità aziendale, CRM o sistemi ERP, per semplificare i flussi di lavoro. |
| Personalizzazione | Cerca un software che ti consenta di adattare le funzionalità alle tue specifiche esigenze di analisi. |
| Semplicità d'uso | Dai priorità a interfacce intuitive che richiedano una formazione minima affinché il tuo team possa utilizzarle in modo efficiente. |
| Budget | Valuta il costo totale, comprese le commissioni nascoste, per assicurarti che sia compatibile con i tuoi vincoli finanziari. |
| Misure di sicurezza | Verifica la presenza di solide misure di protezione dei dati per mantenere al sicuro le informazioni sensibili dalle violazioni. |
| Assistenza | Considera la disponibilità e la qualità dell'assistenza clienti per risolvere rapidamente eventuali problemi. |
| Visualizzazione dei dati | Assicurati che il software offra strumenti efficaci per la visualizzazione e una chiara interpretazione delle informazioni ricavate dai dati. |
Che cos'è un software per l'analisi statistica?
Il software di analisi statistica è uno strumento che aiuta a raccogliere, interpretare e modellare grandi insiemi di dati per individuare schemi e orientare il processo decisionale. Utilizzato da analisti finanziari, ricercatori e data scientist, semplifica i dati complessi attraverso la visualizzazione, la modellazione predittiva e l'analisi delle tendenze.
Questi strumenti sono essenziali per trasformare i dati grezzi in informazioni utili all'azione, aiutando le aziende a prevedere le prestazioni, gestire il rischio e rimanere competitive.
Funzionalità
Quando scegli un software di analisi statistica, cerca funzionalità che supportino concretamente le informazioni finanziarie della tua azienda. Potrebbero includere l'analisi delle serie temporali, i modelli previsionali, la modellazione del rischio o le simulazioni Monte Carlo. Tra le altre funzionalità chiave da cercare ci sono:
- Visualizzazione dei dati: presenta i dati e i risultati dell'analisi statistica complessi in un formato comprensibile attraverso grafici e diagrammi.
- Statistiche descrittive: fornisce misure statistiche di base come media, varianza e deviazione standard per riassumere gli insiemi di dati.
- Verifica delle ipotesi: consente agli utenti di verificare le supposizioni relative a un insieme di dati, una funzione fondamentale per la ricerca scientifica.
- Analisi di regressione: aiuta a comprendere le relazioni tra le variabili e a prevedere le tendenze future sulla base dei dati storici.
- Importazione/Esportazione dei dati: facilita l'importazione dei dati da diverse fonti e l'esportazione dei risultati dell'analisi in vari formati.
- Reportistica automatizzata: genera automaticamente report avanzati, risparmiando tempo e riducendo il rischio di errore umano.
- Analisi in tempo reale: consente di analizzare i dati durante la loro raccolta, una funzione essenziale per i processi decisionali soggetti a vincoli temporali.
- Gestione dei dati: fornisce strumenti per organizzare, archiviare e recuperare i dati in modo efficiente.
- Metodi statistici avanzati: include un'ampia gamma di solide tecniche statistiche per analisi approfondite.
- Funzionalità di integrazione: consente un'integrazione fluida con altri strumenti software, migliorando la funzionalità complessiva e la produttività degli utenti per team di qualsiasi dimensione.
Vantaggi
Che tu scelga SAS, R o Python, il software di analisi statistica ti offre un vantaggio competitivo nel settore finanziario. Ecco alcuni dei vantaggi comuni che puoi aspettarti dal miglior software per l'analisi statistica:
- Maggiore accuratezza: riduce gli errori di calcolo, garantendo analisi dei dati e conclusioni più accurate.
- Risparmio di tempo: automatizza i calcoli complessi, consentendo un'elaborazione e un'analisi dei dati più rapide.
- Visualizzazione dei dati: crea grafici e diagrammi, facilitando la comprensione e l'interpretazione delle informazioni ricavate dai dati.
- Processo decisionale migliorato: fornisce un'analisi affidabile dei dati, aiutando i team a prendere decisioni aziendali informate sulla base delle metriche relative alle prestazioni aziendali.
- Scalabilità: gestisce in modo efficiente grandi insiemi di dati, consentendo di analizzare ampie quantità di informazioni senza problemi di prestazioni.
- Coerenza: standardizza i processi di analisi dei dati, garantendo risultati coerenti tra diversi insiemi di dati e progetti.
- Analisi avanzate: offre modelli e procedure statistiche complesse, consentendo di ottenere informazioni più approfondite e analisi predittive. Questo può essere estremamente utile durante il processo di chiusura e consolidamento.
Costi e prezzi
So che scegliere un software di analisi statistica può diventare rapidamente fonte di confusione. Per semplificare la scelta, ho creato una tabella con i piani tariffari più comuni, i costi medi e ciò che includono:
| Tipo di piano | Prezzo medio | Funzionalità comuni |
|---|---|---|
| Gratuito | $0 | Strumenti statistici di base, opzioni limitate per l'importazione dei dati e supporto della community. |
| Personale | $19-$50/user/month | Strumenti statistici avanzati, visualizzazione dei dati e supporto via email. |
| Aziendale | $51-$125/user/month | Funzionalità di collaborazione, integrazione con altri software e supporto prioritario. |
| Enterprise | Prezzo personalizzato | Analisi complete, account manager dedicato e funzionalità di sicurezza avanzate. |
Domande frequenti sul software di analisi statistica
Ecco alcune risposte alle domande comuni sul software di analisi statistica:
Quali tipi di grafici e visualizzazioni possono essere prodotti utilizzando il software di analisi statistica?
I quattro tipi di grafici utilizzati nell’analisi statistica sono i grafici a barre, a linee, a torta e gli istogrammi. Nello specifico, il software di analisi statistica può eseguire un’ampia gamma di modelli e visualizzazioni dei dati, tra cui l’analisi di regressione, i grafici temporali, i diagrammi di Pareto e i grafici di controllo delle variabili.
Qual è la differenza tra il software di analisi statistica e gli strumenti di visualizzazione dei dati?
Il software di analisi statistica si concentra sull’elaborazione e sull’interpretazione dei dati per individuare tendenze e modelli, mentre gli strumenti di visualizzazione dei dati si concentrano sulla presentazione dei dati in formato visivo. Se devi eseguire calcoli complessi e test statistici, avrai bisogno di un software di analisi statistica. Tuttavia, se il tuo obiettivo è creare grafici o diagrammi, può essere sufficiente uno strumento di visualizzazione.
Il software di analisi statistica è in grado di gestire grandi set di dati?
Sì, la maggior parte dei software di analisi statistica è in grado di gestire grandi set di dati. Tuttavia, la capacità di elaborare in modo efficiente grandi volumi di dati dipende dall’architettura del software e dalle risorse del sistema. Verifica le specifiche del software per conoscere i limiti relativi alle dimensioni dei dati e assicurati che il tuo hardware soddisfi i requisiti consigliati per evitare prestazioni lente.
Sono necessarie competenze tecniche per utilizzare il software di analisi statistica?
Non necessariamente. Sebbene alcuni software richiedano una solida conoscenza della statistica, molti strumenti moderni offrono interfacce intuitive e tutorial per aiutare i principianti. Se non hai esperienza nell’analisi statistica, cerca un software con risorse di supporto complete, come video di formazione e domande frequenti, per facilitare la curva di apprendimento.
E ora:
Se stai cercando un software di analisi statistica, contatta gratuitamente un consulente SoftwareSelect per ricevere consigli.
Compila un modulo e partecipa a una breve conversazione durante la quale il consulente approfondirà le tue esigenze specifiche. In seguito, riceverai una selezione ristretta di software da valutare. Ti supporterà inoltre durante l'intero processo di acquisto, comprese le trattative sul prezzo.